EcoHealth Report Cards
  • About
  • The Process
  • Contact
  • Report Cards
    • Chesapeake Bay
    • Clinton River
    • Detroit River
    • Guanabara Bay
    • Huron River
    • Lake Erie
    • Long Island Sound
    • Maryland Coastal Bays
    • Orinoco River
    • Rio Grande
    • River Raisin
    • Rouge River
    • Southeast Michigan
    • Sudbury, Assabet, & Concord Rivers
    • Verde River
    • Willamette River

Verde River

  • Home
  • Health
  • Indicators
    • Overall Health Index
    • Base Flow
    • Surfacewater BMPs
    • Groundwater BMPs
    • Water Quality Index
    • Water Quality Certainty
    • Turbidity
    • Macroinvertebrates
    • Upland Condition Index
    • Riparian Birds
    • Fish
    • Recreation Planning
    • Visitor Satisfaction
    • Recreation Access
    • Civic Engagement
    • Digital Engagement
    • Healthcare
    • Education
    • Unemployment
    • Affordable Housing
  • Regions
    • Overall
    • Big and Little Chino
    • Upper Verde
    • Upper Verde Valley
    • Oak Creek
    • Lower Verde Valley
    • Wild and Scenic
    • Lower Verde
  • Issues
  • Publications
  • Take Action
  • About
  1. Home
  2. Report Cards
  3. Verde River
  4. About

About

Goals and objectives

This report card is a timely, transparent assessment of Verde River Watershed health as of December 2019. The Report Card is meant to be used as a tool for understanding problem areas in need of restoration or conservation effort, but it is also meant to serve as an outreach tool for use by managers and organizers to highlight particular issues of importance when communicating conservation and restoration with the public. This document was produced by the Nature Conservancy, Friends of the Verde River, and the University of Maryland Center for Environmental Science.

The report card was co-developed with stakeholders from around the Verde River Watershed. The selection of indicators reflects the values stakeholders have for the Verde with an emphasis on those values thought to be under threat. Some of the important threats identified were land-use changes, groundwater pumping, overuse of resources, climate change, and human pollution. To create a report card with these qualities that is relevant to the goals and objectives of the broad set of stakeholders in the basin, the project team held a series of workshops in the basin between November 2018 and April 2019. Workshop participants identified Water, Habitat, and Communities, as high-level values to consider for assessing watershed condition. Specific indicators were subsequently developed within each of these broad categories.

Development process

The Nature Conservancy and Friends of the Verde River received funding from the U.S.D.A. Forest Service and the Nina Mason Pulliam Charitable Trust in Spring 2018 to engage the University of Maryland Center for Environmental Studies, global leaders in science communication, and formally develop the first ever Verde River Watershed Report Card. The Verde Valley cities of Sedona, Cottonwood, Camp Verde, and Clarkdale also funded the effort.

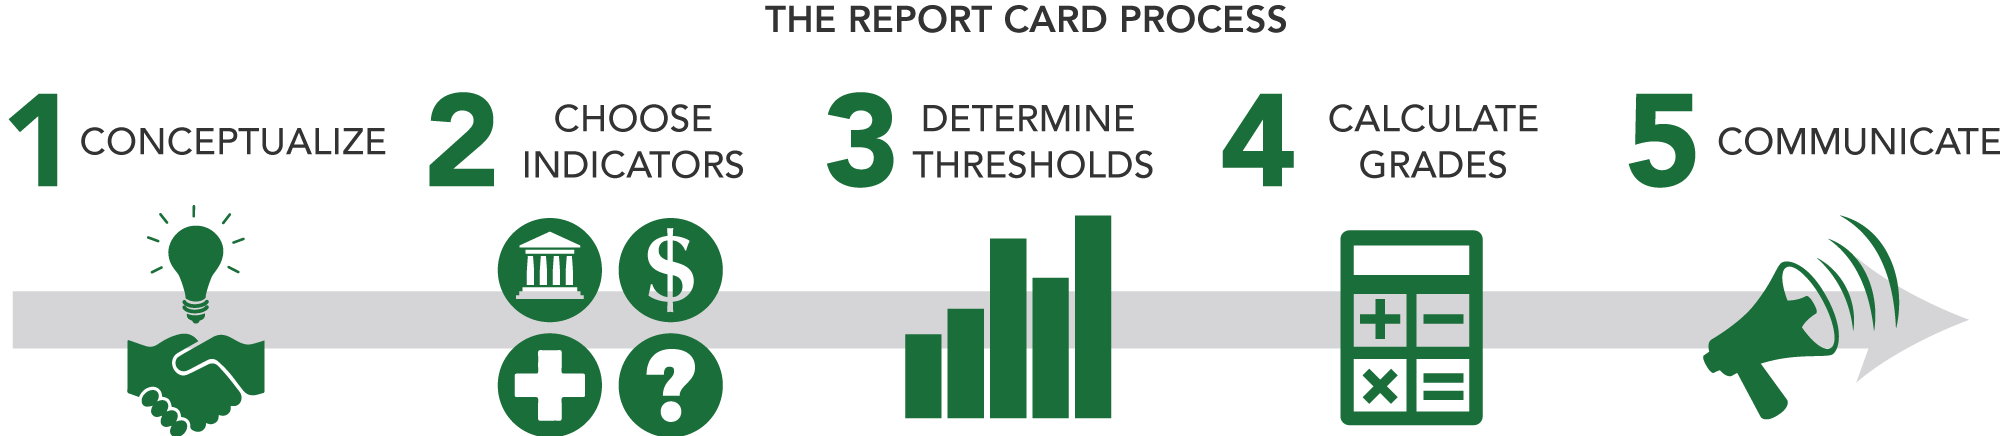
Stakeholder engagement is critical in any report card process, identifying values, selecting indicators, and setting thresholds. Stakeholders were engaged in three large workshops.

In the first workshop (November 13–14, 2018), stakeholders from around the watershed provided input on values and threats to the watershed and some of the most useful ways to indicate watershed condition. The high-level indicator categories were conceptualized and smaller working groups for each of these were established. Following the workshop, a series of conference calls were conducted to further define indicators and identify relevant data sources.

A second workshop was held March 4, 2019 with the purpose of engaging with down-stream water users in the Phoenix Metropolitan Area. These stakeholders were given the opportunity to express their own values and perceived threats to those values for the Verde River Watershed. Alignment between upstream and downstream user values and threats was discussed, as were data sources available from downstream users.

A final stakeholder workshop aimed at refining indicators and defining thresholds was held from April 4-5, 2019. Across the three workshops more than 16 entities from across the Verde River Watershed worked together to develop the indicators and categories used in the Verde River Watershed Report Card.

From October 28-30, 2019 draft scores were reported back to the community at the State of the Verde Watershed Conference. Held at Cliff Castle Casino Resort and Casino on the sovereign lands of the Yavapai-Apache Nation more than 180 conference attendees discussed report card results over a series of field trips, plenary talks, and break out discussions.

The first ever Verde River Watershed Report Card was released February 18, 2020 with tentative plans to update report card results every two to five years.

© 2025 UMCES

  • Home
  • About
  • The Process
  • Contact
  • Report Cards
    • Chesapeake Bay
      • Bay Health
      • Watershed Health
      • Indicators
        • Overall Health Index
        • Dissolved Oxygen
        • Nitrogen
        • Phosphorus
        • Turbidity
        • Water Quality Index
        • Chlorophyll a
        • Water Clarity
        • Aquatic Grasses
        • Benthic Community
        • Blue Crab
        • Bay Anchovy
        • Striped Bass
        • Protected Lands
        • Stewardship
        • Social Index
        • Walkability
        • Heat Vulnerability Index
        • Fish community
        • Median income
        • Housing affordability
        • Income inequality
        • Jobs growth
        • Environmental Justice Index
      • Bay Regions
        • Lower Eastern Shore
        • Choptank River
        • Upper Eastern Shore
        • Upper Western Shore
        • Patapsco and Back Rivers
        • Lower Western Shore
        • Patuxent River
        • Potomac River
        • Rappahannock River
        • York River
        • James River
        • Elizabeth River
      • Watershed Regions
        • Overall
        • Chemung
        • Choptank
        • Elizabeth
        • Juniata
        • Lower Eastern Shore
        • Lower James
        • Lower Potomac
        • Lower Susquehanna
        • Lower Western Shore
        • Middle James
        • Middle Potomac
        • Middle Susquehanna
        • Patapsco and Back
        • Patuxent
        • Rappahannock
        • Shenandoah
        • Upper Eastern Shore
        • Upper James
        • Upper Potomac
        • Upper Susquehanna
        • Upper Western Shore
        • West Branch Susquehanna
        • York
      • Issues
        • 2023
        • 2022
        • 2021
        • 2020
        • 2019
        • 2018
        • 2017
        • 2016
        • 2015
        • 2014
        • 2013
        • 2012
        • 2011
        • 2010
        • 2009
        • 2008
        • 2007
        • 2006
      • Publications
      • Take Action
      • About
    • Clinton River
      • Health
      • Indicators
        • Overall Health Index
        • Household Income
        • Local Ownership
        • Cost of Flooding
        • Income Equality
        • Trade
        • River Economy
        • Wetlands
        • Tree Cover
        • Forests
        • Fish Populations
        • Bird Diversity
        • Benthic Community
        • Protected Lands
        • Fish Consumption
        • Bacteria
        • Heat Vulnerability
        • Air Quality Index
        • Environmental Justice
        • Flooding
        • Sewer Overflows
        • Impervious Surfaces
        • Farmland
        • Affordable Housing
        • Walkability
        • Parks
        • Beach Access
        • Watercraft Access
        • Fishing
        • Nitrogen
        • Phosphorus
        • Dissolved Oxygen
        • Water Temperature
        • Turbidity
      • Region
        • Clinton River
      • Issues
      • Publications
      • About
    • Detroit River
      • Health
      • Indicators
        • Overall Health Index
        • Household Income
        • Local Ownership
        • Cost of Flooding
        • Income Equality
        • Trade
        • River Economy
        • Wetlands
        • Tree Cover
        • Forests
        • Fish Populations
        • Bird Diversity
        • Benthic Community
        • Protected Lands
        • Fish Consumption
        • Bacteria
        • Heat Vulnerability
        • Air Quality Index
        • Environmental Justice
        • Flooding
        • Sewer Overflows
        • Impervious Surfaces
        • Farmland
        • Affordable Housing
        • Walkability
        • Parks
        • Beach Access
        • Watercraft Access
        • Fishing
        • Nitrogen
        • Phosphorus
        • Dissolved Oxygen
        • Water Temperature
        • Turbidity
      • Region
        • Detroit River Watershed
      • Issues
      • Publications
      • About
    • Guanabara Bay
      • Bay Health
      • Basin Health
      • Indicators
        • Overall Health Index
        • Dissolved Oxygen
        • Biological Oxygen Demand
        • Dissolved Inorganic Nitrogen
        • Total Phosphorus
        • Orthophosphate
        • Turbidity
        • Fecal coliform
      • Sanitation
      • Issues
      • Publications
      • About
    • Huron River
      • Health
      • Indicators
        • Overall Health Index
        • Household Income
        • Local Ownership
        • Cost of Flooding
        • Income Equality
        • Trade
        • River Economy
        • Wetlands
        • Tree Cover
        • Forests
        • Fish Populations
        • Bird Diversity
        • Benthic Community
        • Protected Lands
        • Fish Consumption
        • Bacteria
        • Heat Vulnerability
        • Air Quality Index
        • Environmental Justice
        • Flooding
        • Sewer Overflows
        • Impervious Surfaces
        • Farmland
        • Affordable Housing
        • Walkability
        • Parks
        • Beach Access
        • Watercraft Access
        • Fishing
        • Nitrogen
        • Phosphorus
        • Dissolved Oxygen
        • Water Temperature
        • Turbidity
      • Region
        • Huron River
      • Issues
      • Publications
      • About
    • Lake Erie
      • Lake Health
      • Watershed Health
      • Indicators
        • Overall Health Index
        • Total Phosphorus
        • Dissolved Phosphorus
        • Total Nitrogen
        • Nitrate + Nitrite
        • Chlorophyll a
        • Walleye
        • Yellow Perch
        • Emerald Shiner
        • Bloom Index
        • Source Water Toxin
        • Recreational Toxin
        • Total Suspended Solids
        • Fish
        • Macroinvertebrates
        • Habitat Quality
        • Fish Consumption
        • Pesticide
      • Lake Regions
        • Overall Lake
        • Northwest
        • Southwest
        • Maumee
        • Northeast
        • Eastern Islands
        • Sandusky Bay
      • Watershed Regions
        • Overall Watershed
        • Auglaize
        • Cedar/Portage
        • Detroit
        • Essex
        • Raisin/Huron
        • St. Joseph
        • St. Marys
        • Lower Maumee
        • Lower Thames
        • Sandusky
        • Tiffin
        • Upper Maumee
        • Upper Thames
      • Issues
      • Publications
      • Take Action
      • About
    • Long Island Sound
      • Health
      • Indicators
        • Overall Health Index
        • Dissolved Oxygen
        • Chlorophyll a
        • Water Clarity
        • Dissolved Organic Carbon
      • Regions
        • Overall
        • Western Narrows
        • Eastern Narrows
        • Western Basin
        • Central Basin
        • Eastern Basin
      • Issues
        • 2018
        • 2015
        • 2013
      • Publications
      • Take Action
      • About
    • Maryland Coastal Bays
      • Health
      • Indicators
        • Overall Health Index
        • Chlorophyll a
        • Dissolved Oxygen
        • Nitrogen
        • Phosphorus
        • Seagrass
        • Hard Clams
      • Regions
        • Overall
        • Assawoman Bay
        • Chincoteague Bay
        • Isle of Wight Bay
        • Newport Bay
        • Sinepuxent Bay
        • St. Martin River
      • Issues
        • 2023
        • 2022
        • 2021
        • 2019
        • 2018
        • 2017
        • 2016
        • 2015
      • Publications
      • Take Action
      • About
    • Orinoco River
      • Health
      • Indicators
        • Water Quality Index
        • Risks to Water Quality
        • Water Supply and Demand
        • Natural Land Cover
        • Stable Forest Area
        • Terrestrial Connectivity
        • Fire Frequency
        • Ecosystem Services
        • Human Nutrition
        • Mining in Sensitive Ecosystems
        • River Dolphins
      • Regions
        • Arauca River
        • Atabapo River
        • Bita River
        • Guaviare River
        • Inírida River
        • Matavén River
        • Meta River
        • Tomo River
        • Tuparro River
        • Vichada River
      • Issues
      • Publications
      • About
    • Rio Grande
      • Health
      • Indicators
        • Overall Health Index
        • Annual low flow
        • Zero Flow Days
        • Municipal Water Supply
        • Groundwater
        • Agriculture surface water supply
        • Flow Alteration
        • Riparian Areas
        • Water Supply for Compact
        • Impaired Streams
        • Invasive Trees and Shrubs
        • Wetland Loss
        • Bird Diversity
        • Silvery Minnow
        • Native Fish Diversity
        • All Fish Diversity
        • Native peoples and acequias support
        • Native peoples and acequias representation
        • Water Resource Governance
        • Water Resource Management
        • Protected Lands
        • Fire
        • Park Visitation
        • Recreation Access
        • Cultural and Historical Places
        • Walkability
        • Heat Vulnerability Index
        • Social Vulnerability Index
        • Air Quality
        • Affordable Housing
      • Regions
        • Overall
        • Upper Rio Grande - CO
        • Upper Rio Grande - NM
        • Middle Rio Grande
        • Lower Rio Grande
      • Issues
      • Publications
      • About
    • River Raisin
      • Health
      • Indicators
        • Overall Health Index
        • Household Income
        • Local Ownership
        • Cost of Flooding
        • Income Equality
        • Trade
        • River Economy
        • Wetlands
        • Tree Cover
        • Forests
        • Fish Populations
        • Bird Diversity
        • Benthic Community
        • Protected Lands
        • Fish Consumption
        • Bacteria
        • Heat Vulnerability
        • Air Quality Index
        • Environmental Justice
        • Flooding
        • Sewer Overflows
        • Impervious Surfaces
        • Farmland
        • Affordable Housing
        • Walkability
        • Parks
        • Beach Access
        • Watercraft Access
        • Fishing
        • Nitrogen
        • Phosphorus
        • Dissolved Oxygen
        • Water Temperature
        • Turbidity
      • Region
        • River Raisin
      • Issues
      • Publications
      • About
    • Rouge River
      • Health
      • Indicators
        • Overall Health Index
        • Household Income
        • Local Ownership
        • Cost of Flooding
        • Income Equality
        • Trade
        • River Economy
        • Wetlands
        • Tree Cover
        • Forests
        • Fish Populations
        • Bird Diversity
        • Benthic Community
        • Protected Lands
        • Fish Consumption
        • Bacteria
        • Heat Vulnerability
        • Air Quality Index
        • Environmental Justice
        • Flooding
        • Sewer Overflows
        • Impervious Surfaces
        • Farmland
        • Affordable Housing
        • Walkability
        • Parks
        • Beach Access
        • Watercraft Access
        • Fishing
        • Nitrogen
        • Phosphorus
        • Dissolved Oxygen
        • Water Temperature
        • Turbidity
      • Region
        • Rouge River
      • Issues
      • Publications
      • About
    • Southeast Michigan
      • Health
      • Indicators
        • Overall Health Index
        • Household Income
        • Local Ownership
        • Cost of Flooding
        • Income Equality
        • Trade
        • River Economy
        • Wetlands
        • Tree Cover
        • Forests
        • Fish Populations
        • Bird Diversity
        • Benthic Community
        • Protected Lands
        • Fish Consumption
        • Bacteria
        • Heat Vulnerability
        • Air Quality Index
        • Environmental Justice
        • Flooding
        • Sewer Overflows
        • Impervious Surfaces
        • Farmland
        • Affordable Housing
        • Walkability
        • Parks
        • Beach Access
        • Watercraft Access
        • Fishing
        • Nitrogen
        • Phosphorus
        • Dissolved Oxygen
        • Water Temperature
        • Turbidity
      • Regions
        • Overall
        • Clinton
        • Detroit
        • Huron
        • Raisin
        • Rouge
      • Issues
      • Publications
      • About
    • Sudbury, Assabet, & Concord Rivers
      • Health
      • Indicators
        • Overall
        • Dissolved Oxygen
        • Temperature
        • Suspended Solids
        • Phosphorus
        • Nitrogen
        • Floating Biomass
        • Streamflow Alteration
        • Groundwater Level
        • Summer Streamflow
        • Visual Quality
        • Cultural Importance
        • Impervious Cover
        • Aquatic Connectivity
        • Ecological Integrity
        • Passability
        • Access
        • Trails
        • Bacteria
        • Fish Edibility
      • Regions
        • Upper Sudbury River
        • Lower Sudbury River
        • Upper Assabet River
        • Lower Assabet River
        • Upper Concord River
        • Lower Concord River
      • Issues
      • Publications
      • Take Action
        • Discover your rivers
        • Roll up your sleeves
        • Become a citizen scientist or advocate
        • Celebrate success
      • About
    • Verde River
      • Health
      • Indicators
        • Overall Health Index
        • Base Flow
        • Surfacewater BMPs
        • Groundwater BMPs
        • Water Quality Index
        • Water Quality Certainty
        • Turbidity
        • Macroinvertebrates
        • Upland Condition Index
        • Riparian Birds
        • Fish
        • Recreation Planning
        • Visitor Satisfaction
        • Recreation Access
        • Civic Engagement
        • Digital Engagement
        • Healthcare
        • Education
        • Unemployment
        • Affordable Housing
      • Regions
        • Overall
        • Big and Little Chino
        • Upper Verde
        • Upper Verde Valley
        • Oak Creek
        • Lower Verde Valley
        • Wild and Scenic
        • Lower Verde
      • Issues
      • Publications
      • Take Action
      • About
    • Willamette River
      • Health
      • Indicators
        • Overall Health Index
        • Water Quality Index
        • Toxics
        • Temperature
        • Native Fish
        • Non-native Fish
        • Juvenile Chinook
        • Bald Eagle
        • Channel Complexity
        • Floodplain Forest
        • Flow Targets
        • Peak Flows
        • Fish Consumption Advisories
        • Tribal Fisheries
        • Fecal Bacteria
        • Harmful Algal Blooms
      • Regions
        • Upper Willamette
        • Middle Willamette
        • Lower Willamette
      • Issues
      • Publications
      • Take Action
        • Know your river
        • Make a change
        • Join the movement
        • Celebrate success
      • About