
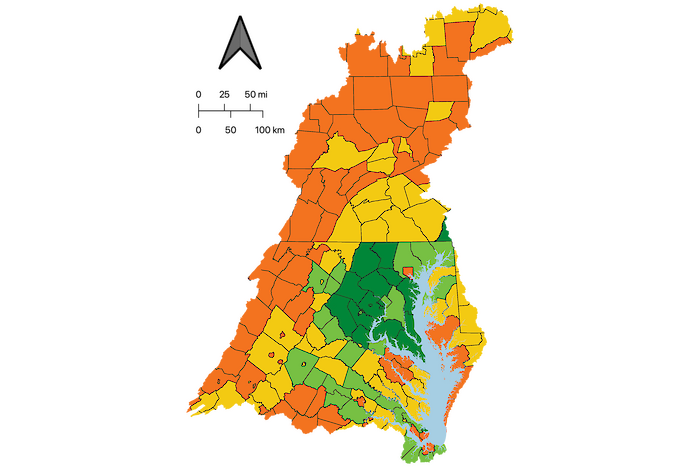
This is traditional, robust measure of economic vitality. When median household income is rising, by definition, more than half of all households are seeing their incomes rise. Greater income is a necessary (if insufficient) condition for greater economic prosperity (source: U.S. Census).
How is it measured?
The U.S. Census Bureau’s five-year American Community Survey contains median household income data at the county level. The data of the 197 counties that intersect the Chesapeake Bay watershed boundary are aggregated into regions, used to calculate a z-score, converted to a report card score, and then weighted by population. For the z-score, median household income data are compared to the mean and standard deviation of the 197 Chesapeake Bay counties.
For the 2021 report card, data from 2019 was used. For the 2022 report card, data from 2020 was used. For the 2023/2024 report card, data from 2021 was used. For the 2025 report card, data from 2022 was used. For the 2026 report card, data from 2023 was used.
Threshold levels
To compare between the four economic indicators, we established a z-score lower and upper bounds (-2.5 to 2.5) that are used to translate a z-score to a 0–100 grading scale—the equation is y = 20x + 50 where y = the report card score and x = the z-score.