EcoHealth Report Cards
  • About
  • The Process
  • Contact
  • Report Cards
    • Chesapeake Bay
    • Clinton River
    • Detroit River
    • Guanabara Bay
    • Huron River
    • Lake Erie
    • Long Island Sound
    • Maryland Coastal Bays
    • Orinoco River
    • Rio Grande
    • River Raisin
    • Rouge River
    • Southeast Michigan
    • Sudbury, Assabet, & Concord Rivers
    • Verde River
    • Willamette River

Lake Erie

  • Home
  • Lake Health
  • Watershed Health
  • Indicators
    • Overall Health Index
    • Total Phosphorus
    • Dissolved Phosphorus
    • Total Nitrogen
    • Nitrate + Nitrite
    • Chlorophyll a
    • Walleye
    • Yellow Perch
    • Emerald Shiner
    • Bloom Index
    • Source Water Toxin
    • Recreational Toxin
    • Total Suspended Solids
    • Fish
    • Macroinvertebrates
    • Habitat Quality
    • Fish Consumption
    • Pesticide
  • Lake Regions
    • Overall Lake
    • Northwest
    • Southwest
    • Maumee
    • Northeast
    • Eastern Islands
    • Sandusky Bay
  • Watershed Regions
    • Overall Watershed
    • Auglaize
    • Cedar/Portage
    • Detroit
    • Essex
    • Raisin/Huron
    • St. Joseph
    • St. Marys
    • Lower Maumee
    • Lower Thames
    • Sandusky
    • Tiffin
    • Upper Maumee
    • Upper Thames
  • Issues
  • Publications
  • Take Action
  • About
  1. Home
  2. Report Cards
  3. Lake Erie
  4. Issues

Issues

Harmful algal blooms occur annually in Western Lake Erie

Harmful algal bloom in Western Basin of Lake Erie on July 2, 2018. NOAA GLERL, Aerial Associates Photography, Inc. by Zachary Haslick.

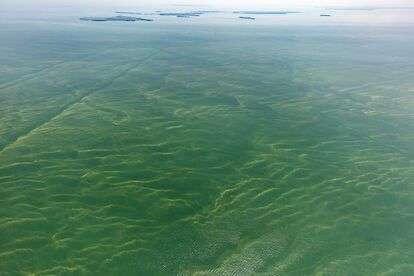
Harmful algal blooms plague Western Lake Erie every year. Factors that affect the location and severity of blooms include rainfall, water temperature, wind, and nutrient inputs. Warm, wet years produce larger blooms as precipitation washes nutrients into the lake. Early warming can cause blooms earlier in the year which may result in smaller blooms that last longer.

Windy conditions can mix lake waters and move algae around, reducing the overall severity of blooms by diffusing the effects. 2018 was an unusual year, with an early bloom onset and strong westerly winds that resulted in the bloom being pushed offshore into the eastern islands region (Bass Islands). From year to year there is a lot of variability in conditions, which lead to more or less severe blooms. Future blooms can be diminished if there are less nutrient inputs from commercial fertilizers and manure.

In an effort to assess annual bloom severity, the United States National Oceanic and Atmospheric Administration (NOAA) has developed a standarized method for assessing algal bloom severity. The Bloom Severity Index is based on the bloom biomass– the amount of algae–over a sustained period, usually 30 days of peak bloom, which normally occurs in July or August. This method does not take into account algal bloom toxicity, but a score of 5 or greater is considered a potentially harmful bloom.

The algal bloom severity index has strong variability from year to year. Colors correspond to report card scores. Data from NOAA, Heidelberg University, U.Mich-NCSU-GLERL, and Limnotech.

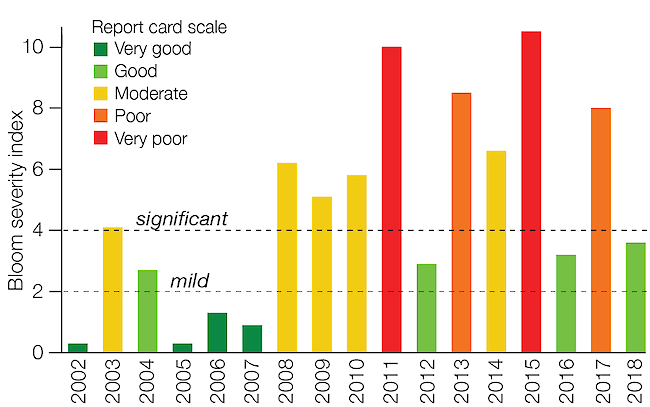
Annual variability in weather conditions cause bloom severity to fluctuate from year to year, as illustrated in the graph above. For example, 2011 and 2013 had severe summer blooms while the 2012 bloom was a mild bloom on the severity index scale. Future blooms can be diminished if there is less nutrient pollution from commericial and residential fertilizers and manure, reducing blooms even in years with high rainfall.

Conditions in Sandusky Bay differ from the rest of the basin

Sandusky Bay. Doug Kane.

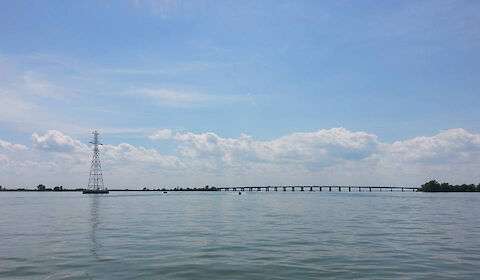
Sandusky Bay is a unique system within the larger Lake Erie basin, largely due to its isolation from the open waters of Western Lake Erie. The shallow Bay is ringed by rich coastal wetlands that provide habitat for fishes and other animals, trap nutrients in the soil, and reduce the effects of wave action within the Bay.

In addition to its productive fisheries, Sandusky Bay provides opportunities for outdoor recreation and tourism. Cedar Point, Sandusky Bay, and the surrounding areas are known as the “Vacationland” region of Ohio.

Excessive nutrient and sediment loading, low flows, and algal blooms have resulted in a reduction of water quality in Sandusky Bay. There is an almost year-round (March–December) bloom of the cyanobacteria Planktothrix in Sandusky Bay. Unlike the open waters of Western Lake Erie, nitrogen levels in the bay tend to be low, especially in the late summer. When algal blooms caused by excess nutrients die off, they are eaten by bacteria, which create oxygen-free (anoxic) conditions. This results in almost constant internal phosphorus loading when phosphorus is released from anoxic sediments.

Reducing nutrient inputs from the Maumee River will improve Western Lake Erie health

The Maumee River as it enters Western Lake Erie at Maumee Bay in Toledo, Ohio. NOAA GLERL.

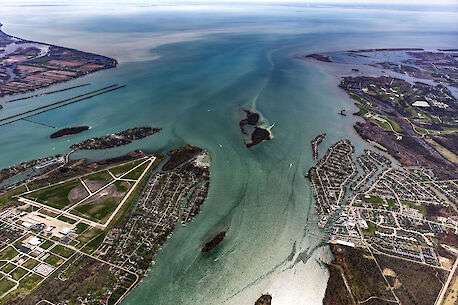
The Maumee River has the largest watershed of any Great Lakes River, covering 8,316 square miles (21,540 km2). It drains portions of Indiana, Michigan, and Ohio before entering Western Lake Erie at Maumee Bay in Toledo, Ohio, a city with a population of nearly 300,000. Fort Wayne, Indiana, with a population of over 250,000, sits at the start of the Maumee River, where the St. Joseph and St. Marys rivers come together.

In addition to the large metropolitan areas at either end of the watershed, nearly two-thirds of the Maumee River watershed is used for agriculture. While the Maumee River only contributes 5% of the flow into Lake Erie, it contributes over 40% of the phosphorus load. This phosphorus load comes primarily from commercial fertilizers and manure as well as residential lawns. The phosphorus washes into Western Lake Erie at Maumee Bay, which tends to be the epicenter of large annual algal blooms. Because of this, the Maumee River watershed is the priority watershed targeted in the Great Lakes Water Quality Agreement. This bi-national agreement seeks to reduce the phosphorus inputs to Western Lake Erie by 40% to maintain healthy levels of algal growth and support a productive Lake Erie ecosystem. Reducing nutrients will improve water quality and habitat for fish and other wildlife. It will also have a positive impact on drinking water supplies and recreational opportunities.

© 2025 UMCES

  • Home
  • About
  • The Process
  • Contact
  • Report Cards
    • Chesapeake Bay
      • Bay Health
      • Watershed Health
      • Indicators
        • Overall Health Index
        • Dissolved Oxygen
        • Nitrogen
        • Phosphorus
        • Turbidity
        • Water Quality Index
        • Chlorophyll a
        • Water Clarity
        • Aquatic Grasses
        • Benthic Community
        • Blue Crab
        • Bay Anchovy
        • Striped Bass
        • Protected Lands
        • Stewardship
        • Social Index
        • Walkability
        • Heat Vulnerability Index
        • Fish community
        • Median income
        • Housing affordability
        • Income inequality
        • Jobs growth
        • Environmental Justice Index
      • Bay Regions
        • Lower Eastern Shore
        • Choptank River
        • Upper Eastern Shore
        • Upper Western Shore
        • Patapsco and Back Rivers
        • Lower Western Shore
        • Patuxent River
        • Potomac River
        • Rappahannock River
        • York River
        • James River
        • Elizabeth River
      • Watershed Regions
        • Overall
        • Chemung
        • Choptank
        • Elizabeth
        • Juniata
        • Lower Eastern Shore
        • Lower James
        • Lower Potomac
        • Lower Susquehanna
        • Lower Western Shore
        • Middle James
        • Middle Potomac
        • Middle Susquehanna
        • Patapsco and Back
        • Patuxent
        • Rappahannock
        • Shenandoah
        • Upper Eastern Shore
        • Upper James
        • Upper Potomac
        • Upper Susquehanna
        • Upper Western Shore
        • West Branch Susquehanna
        • York
      • Issues
        • 2023
        • 2022
        • 2021
        • 2020
        • 2019
        • 2018
        • 2017
        • 2016
        • 2015
        • 2014
        • 2013
        • 2012
        • 2011
        • 2010
        • 2009
        • 2008
        • 2007
        • 2006
      • Publications
      • Take Action
      • About
    • Clinton River
      • Health
      • Indicators
        • Overall Health Index
        • Household Income
        • Local Ownership
        • Cost of Flooding
        • Income Equality
        • Trade
        • River Economy
        • Wetlands
        • Tree Cover
        • Forests
        • Fish Populations
        • Bird Diversity
        • Benthic Community
        • Protected Lands
        • Fish Consumption
        • Bacteria
        • Heat Vulnerability
        • Air Quality Index
        • Environmental Justice
        • Flooding
        • Sewer Overflows
        • Impervious Surfaces
        • Farmland
        • Affordable Housing
        • Walkability
        • Parks
        • Beach Access
        • Watercraft Access
        • Fishing
        • Nitrogen
        • Phosphorus
        • Dissolved Oxygen
        • Water Temperature
        • Turbidity
      • Region
        • Clinton River
      • Issues
      • Publications
      • About
    • Detroit River
      • Health
      • Indicators
        • Overall Health Index
        • Household Income
        • Local Ownership
        • Cost of Flooding
        • Income Equality
        • Trade
        • River Economy
        • Wetlands
        • Tree Cover
        • Forests
        • Fish Populations
        • Bird Diversity
        • Benthic Community
        • Protected Lands
        • Fish Consumption
        • Bacteria
        • Heat Vulnerability
        • Air Quality Index
        • Environmental Justice
        • Flooding
        • Sewer Overflows
        • Impervious Surfaces
        • Farmland
        • Affordable Housing
        • Walkability
        • Parks
        • Beach Access
        • Watercraft Access
        • Fishing
        • Nitrogen
        • Phosphorus
        • Dissolved Oxygen
        • Water Temperature
        • Turbidity
      • Region
        • Detroit River Watershed
      • Issues
      • Publications
      • About
    • Guanabara Bay
      • Bay Health
      • Basin Health
      • Indicators
        • Overall Health Index
        • Dissolved Oxygen
        • Biological Oxygen Demand
        • Dissolved Inorganic Nitrogen
        • Total Phosphorus
        • Orthophosphate
        • Turbidity
        • Fecal coliform
      • Sanitation
      • Issues
      • Publications
      • About
    • Huron River
      • Health
      • Indicators
        • Overall Health Index
        • Household Income
        • Local Ownership
        • Cost of Flooding
        • Income Equality
        • Trade
        • River Economy
        • Wetlands
        • Tree Cover
        • Forests
        • Fish Populations
        • Bird Diversity
        • Benthic Community
        • Protected Lands
        • Fish Consumption
        • Bacteria
        • Heat Vulnerability
        • Air Quality Index
        • Environmental Justice
        • Flooding
        • Sewer Overflows
        • Impervious Surfaces
        • Farmland
        • Affordable Housing
        • Walkability
        • Parks
        • Beach Access
        • Watercraft Access
        • Fishing
        • Nitrogen
        • Phosphorus
        • Dissolved Oxygen
        • Water Temperature
        • Turbidity
      • Region
        • Huron River
      • Issues
      • Publications
      • About
    • Lake Erie
      • Lake Health
      • Watershed Health
      • Indicators
        • Overall Health Index
        • Total Phosphorus
        • Dissolved Phosphorus
        • Total Nitrogen
        • Nitrate + Nitrite
        • Chlorophyll a
        • Walleye
        • Yellow Perch
        • Emerald Shiner
        • Bloom Index
        • Source Water Toxin
        • Recreational Toxin
        • Total Suspended Solids
        • Fish
        • Macroinvertebrates
        • Habitat Quality
        • Fish Consumption
        • Pesticide
      • Lake Regions
        • Overall Lake
        • Northwest
        • Southwest
        • Maumee
        • Northeast
        • Eastern Islands
        • Sandusky Bay
      • Watershed Regions
        • Overall Watershed
        • Auglaize
        • Cedar/Portage
        • Detroit
        • Essex
        • Raisin/Huron
        • St. Joseph
        • St. Marys
        • Lower Maumee
        • Lower Thames
        • Sandusky
        • Tiffin
        • Upper Maumee
        • Upper Thames
      • Issues
      • Publications
      • Take Action
      • About
    • Long Island Sound
      • Health
      • Indicators
        • Overall Health Index
        • Dissolved Oxygen
        • Chlorophyll a
        • Water Clarity
        • Dissolved Organic Carbon
      • Regions
        • Overall
        • Western Narrows
        • Eastern Narrows
        • Western Basin
        • Central Basin
        • Eastern Basin
      • Issues
        • 2018
        • 2015
        • 2013
      • Publications
      • Take Action
      • About
    • Maryland Coastal Bays
      • Health
      • Indicators
        • Overall Health Index
        • Chlorophyll a
        • Dissolved Oxygen
        • Nitrogen
        • Phosphorus
        • Seagrass
        • Hard Clams
      • Regions
        • Overall
        • Assawoman Bay
        • Chincoteague Bay
        • Isle of Wight Bay
        • Newport Bay
        • Sinepuxent Bay
        • St. Martin River
      • Issues
        • 2023
        • 2022
        • 2021
        • 2019
        • 2018
        • 2017
        • 2016
        • 2015
      • Publications
      • Take Action
      • About
    • Orinoco River
      • Health
      • Indicators
        • Water Quality Index
        • Risks to Water Quality
        • Water Supply and Demand
        • Natural Land Cover
        • Stable Forest Area
        • Terrestrial Connectivity
        • Fire Frequency
        • Ecosystem Services
        • Human Nutrition
        • Mining in Sensitive Ecosystems
        • River Dolphins
      • Regions
        • Arauca River
        • Atabapo River
        • Bita River
        • Guaviare River
        • Inírida River
        • Matavén River
        • Meta River
        • Tomo River
        • Tuparro River
        • Vichada River
      • Issues
      • Publications
      • About
    • Rio Grande
      • Health
      • Indicators
        • Overall Health Index
        • Annual low flow
        • Zero Flow Days
        • Municipal Water Supply
        • Groundwater
        • Agriculture surface water supply
        • Flow Alteration
        • Riparian Areas
        • Water Supply for Compact
        • Impaired Streams
        • Invasive Trees and Shrubs
        • Wetland Loss
        • Bird Diversity
        • Silvery Minnow
        • Native Fish Diversity
        • All Fish Diversity
        • Native peoples and acequias support
        • Native peoples and acequias representation
        • Water Resource Governance
        • Water Resource Management
        • Protected Lands
        • Fire
        • Park Visitation
        • Recreation Access
        • Cultural and Historical Places
        • Walkability
        • Heat Vulnerability Index
        • Social Vulnerability Index
        • Air Quality
        • Affordable Housing
      • Regions
        • Overall
        • Upper Rio Grande - CO
        • Upper Rio Grande - NM
        • Middle Rio Grande
        • Lower Rio Grande
      • Issues
      • Publications
      • About
    • River Raisin
      • Health
      • Indicators
        • Overall Health Index
        • Household Income
        • Local Ownership
        • Cost of Flooding
        • Income Equality
        • Trade
        • River Economy
        • Wetlands
        • Tree Cover
        • Forests
        • Fish Populations
        • Bird Diversity
        • Benthic Community
        • Protected Lands
        • Fish Consumption
        • Bacteria
        • Heat Vulnerability
        • Air Quality Index
        • Environmental Justice
        • Flooding
        • Sewer Overflows
        • Impervious Surfaces
        • Farmland
        • Affordable Housing
        • Walkability
        • Parks
        • Beach Access
        • Watercraft Access
        • Fishing
        • Nitrogen
        • Phosphorus
        • Dissolved Oxygen
        • Water Temperature
        • Turbidity
      • Region
        • River Raisin
      • Issues
      • Publications
      • About
    • Rouge River
      • Health
      • Indicators
        • Overall Health Index
        • Household Income
        • Local Ownership
        • Cost of Flooding
        • Income Equality
        • Trade
        • River Economy
        • Wetlands
        • Tree Cover
        • Forests
        • Fish Populations
        • Bird Diversity
        • Benthic Community
        • Protected Lands
        • Fish Consumption
        • Bacteria
        • Heat Vulnerability
        • Air Quality Index
        • Environmental Justice
        • Flooding
        • Sewer Overflows
        • Impervious Surfaces
        • Farmland
        • Affordable Housing
        • Walkability
        • Parks
        • Beach Access
        • Watercraft Access
        • Fishing
        • Nitrogen
        • Phosphorus
        • Dissolved Oxygen
        • Water Temperature
        • Turbidity
      • Region
        • Rouge River
      • Issues
      • Publications
      • About
    • Southeast Michigan
      • Health
      • Indicators
        • Overall Health Index
        • Household Income
        • Local Ownership
        • Cost of Flooding
        • Income Equality
        • Trade
        • River Economy
        • Wetlands
        • Tree Cover
        • Forests
        • Fish Populations
        • Bird Diversity
        • Benthic Community
        • Protected Lands
        • Fish Consumption
        • Bacteria
        • Heat Vulnerability
        • Air Quality Index
        • Environmental Justice
        • Flooding
        • Sewer Overflows
        • Impervious Surfaces
        • Farmland
        • Affordable Housing
        • Walkability
        • Parks
        • Beach Access
        • Watercraft Access
        • Fishing
        • Nitrogen
        • Phosphorus
        • Dissolved Oxygen
        • Water Temperature
        • Turbidity
      • Regions
        • Overall
        • Clinton
        • Detroit
        • Huron
        • Raisin
        • Rouge
      • Issues
      • Publications
      • About
    • Sudbury, Assabet, & Concord Rivers
      • Health
      • Indicators
        • Overall
        • Dissolved Oxygen
        • Temperature
        • Suspended Solids
        • Phosphorus
        • Nitrogen
        • Floating Biomass
        • Streamflow Alteration
        • Groundwater Level
        • Summer Streamflow
        • Visual Quality
        • Cultural Importance
        • Impervious Cover
        • Aquatic Connectivity
        • Ecological Integrity
        • Passability
        • Access
        • Trails
        • Bacteria
        • Fish Edibility
      • Regions
        • Upper Sudbury River
        • Lower Sudbury River
        • Upper Assabet River
        • Lower Assabet River
        • Upper Concord River
        • Lower Concord River
      • Issues
      • Publications
      • Take Action
        • Discover your rivers
        • Roll up your sleeves
        • Become a citizen scientist or advocate
        • Celebrate success
      • About
    • Verde River
      • Health
      • Indicators
        • Overall Health Index
        • Base Flow
        • Surfacewater BMPs
        • Groundwater BMPs
        • Water Quality Index
        • Water Quality Certainty
        • Turbidity
        • Macroinvertebrates
        • Upland Condition Index
        • Riparian Birds
        • Fish
        • Recreation Planning
        • Visitor Satisfaction
        • Recreation Access
        • Civic Engagement
        • Digital Engagement
        • Healthcare
        • Education
        • Unemployment
        • Affordable Housing
      • Regions
        • Overall
        • Big and Little Chino
        • Upper Verde
        • Upper Verde Valley
        • Oak Creek
        • Lower Verde Valley
        • Wild and Scenic
        • Lower Verde
      • Issues
      • Publications
      • Take Action
      • About
    • Willamette River
      • Health
      • Indicators
        • Overall Health Index
        • Water Quality Index
        • Toxics
        • Temperature
        • Native Fish
        • Non-native Fish
        • Juvenile Chinook
        • Bald Eagle
        • Channel Complexity
        • Floodplain Forest
        • Flow Targets
        • Peak Flows
        • Fish Consumption Advisories
        • Tribal Fisheries
        • Fecal Bacteria
        • Harmful Algal Blooms
      • Regions
        • Upper Willamette
        • Middle Willamette
        • Lower Willamette
      • Issues
      • Publications
      • Take Action
        • Know your river
        • Make a change
        • Join the movement
        • Celebrate success
      • About