EcoHealth Report Cards
  • About
  • The Process
  • Contact
  • Report Cards
    • Chesapeake Bay
    • Clinton River
    • Detroit River
    • Guanabara Bay
    • Huron River
    • Lake Erie
    • Long Island Sound
    • Maryland Coastal Bays
    • Orinoco River
    • Rio Grande
    • River Raisin
    • Rouge River
    • Southeast Michigan
    • Sudbury, Assabet, & Concord Rivers
    • Verde River
    • Willamette River

Long Island Sound

  • Home
  • Health
  • Indicators
    • Overall Health Index
    • Dissolved Oxygen
    • Chlorophyll a
    • Water Clarity
    • Dissolved Organic Carbon
  • Regions
    • Overall
    • Western Narrows
    • Eastern Narrows
    • Western Basin
    • Central Basin
    • Eastern Basin
  • Issues
    • 2018
    • 2015
    • 2013
  • Publications
  • Take Action
  • About
  1. Home
  2. Report Cards
  3. Long Island Sound
  4. Issues
  5. 2018

2018: Investing in sewage treatment improves water quality

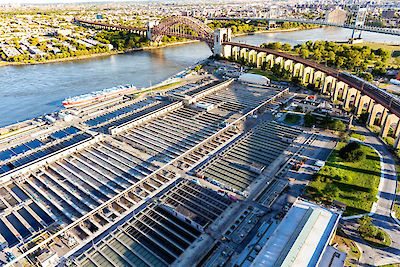
When New York and Connecticut built our sewage treatment plants decades ago, the public appreciated the reduction of fecal bacteria and other contaminants that allowed for swimming and sports, and harvesting of healthy shellfish. Considered less of a threat at the time was the devastating impact of high volumes of human-sourced nutrients on ecosystem health and the quality of life in coastal communities. By the 1980s, the steady increase in population and the nutrients excreted by humans into our toilet bowls caught up with Long Island Sound; traditional sewage treatment plants do not remove these nutrients. Harbors full of dying fish and shellfish, dirty beaches, and waters almost devoid of oxygen got the attention of the public and EPA. In 2000, EPA, New York State, and Connecticut agreed to make a significant investment in a clean and healthy Sound. More than two billion dollars were invested over the following 16 years to treat nitrogen at dozens of sewage treatment plants that discharge to the Sound—ultimately achieving a 58.5% reduction in the amount of nitrogen entering Long Island Sound from those plants. And it seems to be working! While ecosystems don’t change overnight, this Report Card shows how a coordinated investment in treating our sewage is improving water quality in the open waters of the Sound. Most importantly, dissolved oxygen—critical to sustaining aquatic life—is improving in the far western Sound. After decades, the low oxygen zone found in the Western Sound each summer is shrinking and fish die-offs are smaller and less frequent. Pressure from increasing human population, rising temperatures, and other ecosystem stressors requires that we continue to ratchet down on the amount of nitrogen entering the Sound from all sources, including fertilizers and the roughly 500,000 septic systems in coastal communities. Read on to learn how you can help!

Water quality in your bay or harbor

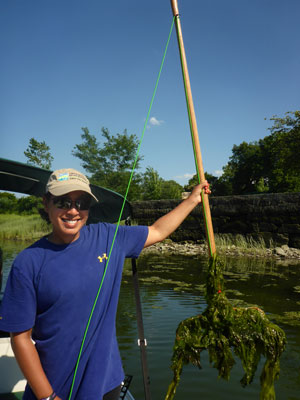
Ask a shoreline resident about the Sound and they’ll likely talk about their local harbor, cove, or bay. These inlets, or “embayments,” are often where people have the most direct and intimate contact with the Sound. Each is unique, with varying water quality influenced in large part by the conditions on the land that drains to the embayment, including the community’s infrastructure, and development patterns. Sadly, many of these embayments exhibit signs of ecosystem stress—algae blooms, low oxygen, and loss of desirable plants and animals. And research shows that these embayments do not all respond in the same way to Sound-wide management activity. Until recently we have not had a good measurement of how the 100+ embayments of Long Island Sound are faring in terms of environmental health, and how they compare with one another. Thanks to a Sound-wide community monitoring program launched in 2017, we are now gathering those data! The Unified Water Study is a collaborative network of monitoring groups, trained and coordinated by Save the Sound, which is following the same monitoring protocol in 36 embayments. The program spans the full length of Long Island Sound. Look for results from this monitoring program in future Report Cards.

Learn more about the Unified Water Study: LIS Embayment Research at savethesound.org/unified-water-study

The bounty of Long Island Sound

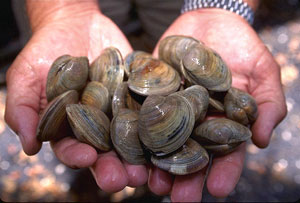
Long Island Sound is an estuary—one of the most productive types of ecosystems on Earth. It’s home to countless marine species including 170 known species of fish, as well as sea turtles, seals, whales, and dozens of species of migratory birds. The Sound and the natural areas draining to it are an economic engine providing approximately 200,000 jobs and ecosystem services valued at between $17 billion and $37 billion a year. Millions of people enjoy the Sound’s fresh fish and shellfish year-round, and the pleasure of open beaches every summer. Long Island Sound has 220+ beautiful beaches, more than half of which are open to the public. Continued investment in our sewage infrastructure is required to keep our beaches, and our shellfish, healthy and accessible for public enjoyment. Clean water is at the center of Long Island Sound’s productivity and shoreline residents’ quality of life!

This Report Card does not include data or grades for fecal bacteria levels in Sound waters; however, in 2019 we will publish a LIS Beach Report. For historic data on the Sound’s beach water quality, visit SoundHealthExplorer.org.

In this section

  • Issues
    • 2018
    • 2015
    • 2013

© 2025 UMCES

  • Home
  • About
  • The Process
  • Contact
  • Report Cards
    • Chesapeake Bay
      • Bay Health
      • Watershed Health
      • Indicators
        • Overall Health Index
        • Dissolved Oxygen
        • Nitrogen
        • Phosphorus
        • Turbidity
        • Water Quality Index
        • Chlorophyll a
        • Water Clarity
        • Aquatic Grasses
        • Benthic Community
        • Blue Crab
        • Bay Anchovy
        • Striped Bass
        • Protected Lands
        • Stewardship
        • Social Index
        • Walkability
        • Heat Vulnerability Index
        • Fish community
        • Median income
        • Housing affordability
        • Income inequality
        • Jobs growth
        • Environmental Justice Index
      • Bay Regions
        • Lower Eastern Shore
        • Choptank River
        • Upper Eastern Shore
        • Upper Western Shore
        • Patapsco and Back Rivers
        • Lower Western Shore
        • Patuxent River
        • Potomac River
        • Rappahannock River
        • York River
        • James River
        • Elizabeth River
      • Watershed Regions
        • Overall
        • Chemung
        • Choptank
        • Elizabeth
        • Juniata
        • Lower Eastern Shore
        • Lower James
        • Lower Potomac
        • Lower Susquehanna
        • Lower Western Shore
        • Middle James
        • Middle Potomac
        • Middle Susquehanna
        • Patapsco and Back
        • Patuxent
        • Rappahannock
        • Shenandoah
        • Upper Eastern Shore
        • Upper James
        • Upper Potomac
        • Upper Susquehanna
        • Upper Western Shore
        • West Branch Susquehanna
        • York
      • Issues
        • 2023
        • 2022
        • 2021
        • 2020
        • 2019
        • 2018
        • 2017
        • 2016
        • 2015
        • 2014
        • 2013
        • 2012
        • 2011
        • 2010
        • 2009
        • 2008
        • 2007
        • 2006
      • Publications
      • Take Action
      • About
    • Clinton River
      • Health
      • Indicators
        • Overall Health Index
        • Household Income
        • Local Ownership
        • Cost of Flooding
        • Income Equality
        • Trade
        • River Economy
        • Wetlands
        • Tree Cover
        • Forests
        • Fish Populations
        • Bird Diversity
        • Benthic Community
        • Protected Lands
        • Fish Consumption
        • Bacteria
        • Heat Vulnerability
        • Air Quality Index
        • Environmental Justice
        • Flooding
        • Sewer Overflows
        • Impervious Surfaces
        • Farmland
        • Affordable Housing
        • Walkability
        • Parks
        • Beach Access
        • Watercraft Access
        • Fishing
        • Nitrogen
        • Phosphorus
        • Dissolved Oxygen
        • Water Temperature
        • Turbidity
      • Region
        • Clinton River
      • Issues
      • Publications
      • About
    • Detroit River
      • Health
      • Indicators
        • Overall Health Index
        • Household Income
        • Local Ownership
        • Cost of Flooding
        • Income Equality
        • Trade
        • River Economy
        • Wetlands
        • Tree Cover
        • Forests
        • Fish Populations
        • Bird Diversity
        • Benthic Community
        • Protected Lands
        • Fish Consumption
        • Bacteria
        • Heat Vulnerability
        • Air Quality Index
        • Environmental Justice
        • Flooding
        • Sewer Overflows
        • Impervious Surfaces
        • Farmland
        • Affordable Housing
        • Walkability
        • Parks
        • Beach Access
        • Watercraft Access
        • Fishing
        • Nitrogen
        • Phosphorus
        • Dissolved Oxygen
        • Water Temperature
        • Turbidity
      • Region
        • Detroit River Watershed
      • Issues
      • Publications
      • About
    • Guanabara Bay
      • Bay Health
      • Basin Health
      • Indicators
        • Overall Health Index
        • Dissolved Oxygen
        • Biological Oxygen Demand
        • Dissolved Inorganic Nitrogen
        • Total Phosphorus
        • Orthophosphate
        • Turbidity
        • Fecal coliform
      • Sanitation
      • Issues
      • Publications
      • About
    • Huron River
      • Health
      • Indicators
        • Overall Health Index
        • Household Income
        • Local Ownership
        • Cost of Flooding
        • Income Equality
        • Trade
        • River Economy
        • Wetlands
        • Tree Cover
        • Forests
        • Fish Populations
        • Bird Diversity
        • Benthic Community
        • Protected Lands
        • Fish Consumption
        • Bacteria
        • Heat Vulnerability
        • Air Quality Index
        • Environmental Justice
        • Flooding
        • Sewer Overflows
        • Impervious Surfaces
        • Farmland
        • Affordable Housing
        • Walkability
        • Parks
        • Beach Access
        • Watercraft Access
        • Fishing
        • Nitrogen
        • Phosphorus
        • Dissolved Oxygen
        • Water Temperature
        • Turbidity
      • Region
        • Huron River
      • Issues
      • Publications
      • About
    • Lake Erie
      • Lake Health
      • Watershed Health
      • Indicators
        • Overall Health Index
        • Total Phosphorus
        • Dissolved Phosphorus
        • Total Nitrogen
        • Nitrate + Nitrite
        • Chlorophyll a
        • Walleye
        • Yellow Perch
        • Emerald Shiner
        • Bloom Index
        • Source Water Toxin
        • Recreational Toxin
        • Total Suspended Solids
        • Fish
        • Macroinvertebrates
        • Habitat Quality
        • Fish Consumption
        • Pesticide
      • Lake Regions
        • Overall Lake
        • Northwest
        • Southwest
        • Maumee
        • Northeast
        • Eastern Islands
        • Sandusky Bay
      • Watershed Regions
        • Overall Watershed
        • Auglaize
        • Cedar/Portage
        • Detroit
        • Essex
        • Raisin/Huron
        • St. Joseph
        • St. Marys
        • Lower Maumee
        • Lower Thames
        • Sandusky
        • Tiffin
        • Upper Maumee
        • Upper Thames
      • Issues
      • Publications
      • Take Action
      • About
    • Long Island Sound
      • Health
      • Indicators
        • Overall Health Index
        • Dissolved Oxygen
        • Chlorophyll a
        • Water Clarity
        • Dissolved Organic Carbon
      • Regions
        • Overall
        • Western Narrows
        • Eastern Narrows
        • Western Basin
        • Central Basin
        • Eastern Basin
      • Issues
        • 2018
        • 2015
        • 2013
      • Publications
      • Take Action
      • About
    • Maryland Coastal Bays
      • Health
      • Indicators
        • Overall Health Index
        • Chlorophyll a
        • Dissolved Oxygen
        • Nitrogen
        • Phosphorus
        • Seagrass
        • Hard Clams
      • Regions
        • Overall
        • Assawoman Bay
        • Chincoteague Bay
        • Isle of Wight Bay
        • Newport Bay
        • Sinepuxent Bay
        • St. Martin River
      • Issues
        • 2023
        • 2022
        • 2021
        • 2019
        • 2018
        • 2017
        • 2016
        • 2015
      • Publications
      • Take Action
      • About
    • Orinoco River
      • Health
      • Indicators
        • Water Quality Index
        • Risks to Water Quality
        • Water Supply and Demand
        • Natural Land Cover
        • Stable Forest Area
        • Terrestrial Connectivity
        • Fire Frequency
        • Ecosystem Services
        • Human Nutrition
        • Mining in Sensitive Ecosystems
        • River Dolphins
      • Regions
        • Arauca River
        • Atabapo River
        • Bita River
        • Guaviare River
        • Inírida River
        • Matavén River
        • Meta River
        • Tomo River
        • Tuparro River
        • Vichada River
      • Issues
      • Publications
      • About
    • Rio Grande
      • Health
      • Indicators
        • Overall Health Index
        • Annual low flow
        • Zero Flow Days
        • Municipal Water Supply
        • Groundwater
        • Agriculture surface water supply
        • Flow Alteration
        • Riparian Areas
        • Water Supply for Compact
        • Impaired Streams
        • Invasive Trees and Shrubs
        • Wetland Loss
        • Bird Diversity
        • Silvery Minnow
        • Native Fish Diversity
        • All Fish Diversity
        • Native peoples and acequias support
        • Native peoples and acequias representation
        • Water Resource Governance
        • Water Resource Management
        • Protected Lands
        • Fire
        • Park Visitation
        • Recreation Access
        • Cultural and Historical Places
        • Walkability
        • Heat Vulnerability Index
        • Social Vulnerability Index
        • Air Quality
        • Affordable Housing
      • Regions
        • Overall
        • Upper Rio Grande - CO
        • Upper Rio Grande - NM
        • Middle Rio Grande
        • Lower Rio Grande
      • Issues
      • Publications
      • About
    • River Raisin
      • Health
      • Indicators
        • Overall Health Index
        • Household Income
        • Local Ownership
        • Cost of Flooding
        • Income Equality
        • Trade
        • River Economy
        • Wetlands
        • Tree Cover
        • Forests
        • Fish Populations
        • Bird Diversity
        • Benthic Community
        • Protected Lands
        • Fish Consumption
        • Bacteria
        • Heat Vulnerability
        • Air Quality Index
        • Environmental Justice
        • Flooding
        • Sewer Overflows
        • Impervious Surfaces
        • Farmland
        • Affordable Housing
        • Walkability
        • Parks
        • Beach Access
        • Watercraft Access
        • Fishing
        • Nitrogen
        • Phosphorus
        • Dissolved Oxygen
        • Water Temperature
        • Turbidity
      • Region
        • River Raisin
      • Issues
      • Publications
      • About
    • Rouge River
      • Health
      • Indicators
        • Overall Health Index
        • Household Income
        • Local Ownership
        • Cost of Flooding
        • Income Equality
        • Trade
        • River Economy
        • Wetlands
        • Tree Cover
        • Forests
        • Fish Populations
        • Bird Diversity
        • Benthic Community
        • Protected Lands
        • Fish Consumption
        • Bacteria
        • Heat Vulnerability
        • Air Quality Index
        • Environmental Justice
        • Flooding
        • Sewer Overflows
        • Impervious Surfaces
        • Farmland
        • Affordable Housing
        • Walkability
        • Parks
        • Beach Access
        • Watercraft Access
        • Fishing
        • Nitrogen
        • Phosphorus
        • Dissolved Oxygen
        • Water Temperature
        • Turbidity
      • Region
        • Rouge River
      • Issues
      • Publications
      • About
    • Southeast Michigan
      • Health
      • Indicators
        • Overall Health Index
        • Household Income
        • Local Ownership
        • Cost of Flooding
        • Income Equality
        • Trade
        • River Economy
        • Wetlands
        • Tree Cover
        • Forests
        • Fish Populations
        • Bird Diversity
        • Benthic Community
        • Protected Lands
        • Fish Consumption
        • Bacteria
        • Heat Vulnerability
        • Air Quality Index
        • Environmental Justice
        • Flooding
        • Sewer Overflows
        • Impervious Surfaces
        • Farmland
        • Affordable Housing
        • Walkability
        • Parks
        • Beach Access
        • Watercraft Access
        • Fishing
        • Nitrogen
        • Phosphorus
        • Dissolved Oxygen
        • Water Temperature
        • Turbidity
      • Regions
        • Overall
        • Clinton
        • Detroit
        • Huron
        • Raisin
        • Rouge
      • Issues
      • Publications
      • About
    • Sudbury, Assabet, & Concord Rivers
      • Health
      • Indicators
        • Overall
        • Dissolved Oxygen
        • Temperature
        • Suspended Solids
        • Phosphorus
        • Nitrogen
        • Floating Biomass
        • Streamflow Alteration
        • Groundwater Level
        • Summer Streamflow
        • Visual Quality
        • Cultural Importance
        • Impervious Cover
        • Aquatic Connectivity
        • Ecological Integrity
        • Passability
        • Access
        • Trails
        • Bacteria
        • Fish Edibility
      • Regions
        • Upper Sudbury River
        • Lower Sudbury River
        • Upper Assabet River
        • Lower Assabet River
        • Upper Concord River
        • Lower Concord River
      • Issues
      • Publications
      • Take Action
        • Discover your rivers
        • Roll up your sleeves
        • Become a citizen scientist or advocate
        • Celebrate success
      • About
    • Verde River
      • Health
      • Indicators
        • Overall Health Index
        • Base Flow
        • Surfacewater BMPs
        • Groundwater BMPs
        • Water Quality Index
        • Water Quality Certainty
        • Turbidity
        • Macroinvertebrates
        • Upland Condition Index
        • Riparian Birds
        • Fish
        • Recreation Planning
        • Visitor Satisfaction
        • Recreation Access
        • Civic Engagement
        • Digital Engagement
        • Healthcare
        • Education
        • Unemployment
        • Affordable Housing
      • Regions
        • Overall
        • Big and Little Chino
        • Upper Verde
        • Upper Verde Valley
        • Oak Creek
        • Lower Verde Valley
        • Wild and Scenic
        • Lower Verde
      • Issues
      • Publications
      • Take Action
      • About
    • Willamette River
      • Health
      • Indicators
        • Overall Health Index
        • Water Quality Index
        • Toxics
        • Temperature
        • Native Fish
        • Non-native Fish
        • Juvenile Chinook
        • Bald Eagle
        • Channel Complexity
        • Floodplain Forest
        • Flow Targets
        • Peak Flows
        • Fish Consumption Advisories
        • Tribal Fisheries
        • Fecal Bacteria
        • Harmful Algal Blooms
      • Regions
        • Upper Willamette
        • Middle Willamette
        • Lower Willamette
      • Issues
      • Publications
      • Take Action
        • Know your river
        • Make a change
        • Join the movement
        • Celebrate success
      • About