2025 Chesapeake Bay & Watershed Report Card
This report card provides a transparent, timely, and geographically detailed assessment of Chesapeake Bay and its Watershed. Since 2016, UMCES has engaged stakeholders throughout the watershed to transform the report card into an evaluation of the Chesapeake Watershed health. Watershed health includes traditional ecological indicators, but also economic and societal indicators. This is the sixth year the watershed has been scored, and one new ecological indicator, Temperature Stress, has been added.
Overall, the Chesapeake Watershed scored 57%, a C+. There were five ecological indicators, four economic indicators, and three societal indicators.
Overall, Chesapeake Bay scored 50%, a C, in 2025. This was a slight downturn from the previous year, but still a significantly improving long-term trend.
Reporte de salud de 2025 sobre la bahía de Chesapeake y su cuenca hidrográfica
Este informe proporciona una evaluación transparente, oportuna, y geográficamente detallada de la bahía de Chesapeake y su cuenca. Desde 2016, UMCES ha involucrado a las partes interesadas de toda la cuenca para transformar el informe en una evaluación de la salud de la cuenca de Chesapeake. Los indicadores de la bahía evalúan la salud del ecosistema acuático, mientras que los indicadores de la cuenca hidrográfica cubren las condiciones ecológicas, sociales, y económicas. Este es el sexto año que se evalúa la cuenca, y se ha añadido un nuevo indicador ecológico: el estrés térmico.
En general, la cuenca hidrográfica de la bahía de Chesapeake obtuvo una puntuación de C+ (57%). Se incluyeron cinco indicadores ecológicos, cuatro indicadores económicos, y tres indicadores sociales.
La nota global de la bahía de Chesapeake fue una C (50%), en 2025, un ligero descenso respecto del año anterior, pero aun así una tendencia a largo plazo de mejora significativa.

1925 Chesapeake Bay Report Card
The 1925 Chesapeake Bay Report Card was produced to celebrate the UMCES Centennial. Inspired by 1920s design, this report card offers a glimpse of what a Chesapeake Bay Report Card might have been like in 1925, when UMCES was founded. The state of the Bay in 1925 is not an accurate scientific assessment, but an estimation based on informed opinions and broad historical generalizations. The document is meant to highlight the region's history, including the founding of the Chesapeake Biological Laboratory by Dr. Reginald Truitt, and show how things have changed for the Chesapeake Bay and watershed in the last 100 years.

Reporte de salud de 1925 sobre la bahía de Chesapeake
El Reporte de Salud de la bahía de Chesapeake de 1925 se elaboró para celebrar el centenario de la UMCES. Inspirado en el diseño de la década de 1920, este informe ofrece una visión de cómo habría sido un Reporte de salud sobre la bahía de Chesapeake en 1925, cuando se fundó la UMCES. El estado de la bahía en 1925 no es una evaluación científica precisa, sino una estimación basada en opiniones fundamentadas, y generalizaciones históricas generales. El documento pretende destacar la historia de la región, incluyendo la fundación del Laboratorio Biológico de Chesapeake por el Dr. Reginald Truitt, y mostrar cómo han cambiado las cosas para la bahía de Chesapeake y su cuenca hidrográfica en los últimos 100 años.

2023/2024 Chesapeake Bay & Watershed Report Card
This report card provides a transparent, timely, and geographically detailed assessment of Chesapeake Bay and its Watershed. Since 2016, UMCES has engaged stakeholders throughout the watershed to transform the report card into an evaluation of the Chesapeake Watershed health. Watershed health includes traditional ecological indicators, but also economic and societal indicators. This is the fifth year the watershed has been scored, and while no new indicators were included this year there were multiple updates to existing indicators. Linkages and relationships between the ecological, economic, and societal indicators will be evaluated in future report cards.
Overall, the Chesapeake Watershed scored 52%, a C. There were four ecological indicators, four economic indicators, and four societal indicators.
Overall, Chesapeake Bay scored 55%, a C+, in 2023, showing a significantly improving trend. This is the highest overall grade for the bay since 2002.
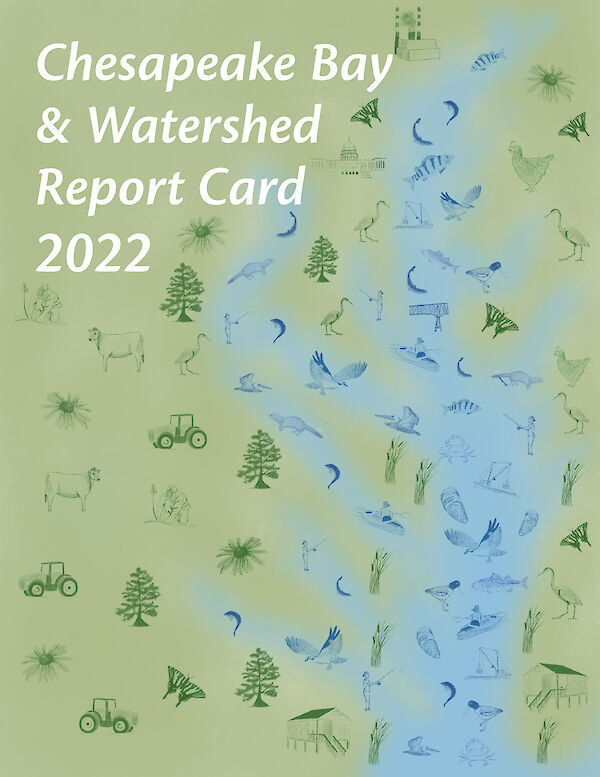
2022 Chesapeake Bay & Watershed Report Card
This report card provides a transparent, timely, and geographically detailed assessment of Chesapeake Bay and its Watershed. Since 2016, UMCES has engaged stakeholders throughout the watershed to transform the report card into an evaluation of the Chesapeake Watershed health. Watershed health includes traditional ecological indicators, but also economic and societal indicators. This is the fourth year the watershed has been scored, and one new ecological indicator has been added. Linkages and relationships between the ecological, economic, and societal indicators will be evaluated in future report cards.
Overall, the Chesapeake Watershed scored 52%, a C. There were four ecological indicators, four economic indicators, and four societal indicators. This is the first year evaluating an Environmental Justice Index, though it is not included in the overall watershed health score.
Overall, Chesapeake Bay scored 51%, a C, in 2022, showing a significantly improving trend. While northern tributaries show improving trends, many tributaries scored poorly with no significant trends from the previous year.
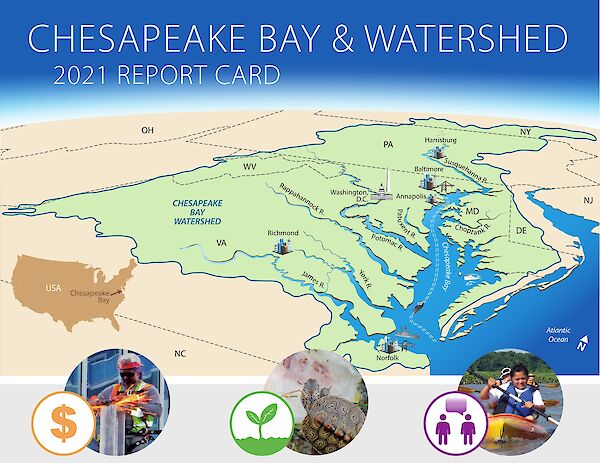
2021 Chesapeake Bay & Watershed Report Card
This report card provides a transparent, timely, and geographically detailed assessment of Chesapeake Bay and its Watershed. Since 2016, UMCES has engaged stakeholders throughout the watershed to transform the report card into an evaluation of the Chesapeake Watershed health. Watershed health includes traditional ecological indicators, but also economic and societal indicators. This is the third year the watershed has been scored, and four new economic indicators have been added. Linkages and relationships between the ecological, economic, and societal indicators will be evaluated in future report cards.
Overall, the Chesapeake Watershed scored 56%, a C+. There were three ecological indicators, four economic indicators, and four societal indicators.
Overall, Chesapeake Bay scored 50%, a C in 2021, which improved slightly since 2020. Long-term trends are still showing improvement for the overall Bay and four other regions, while one region is showing a declining trend.
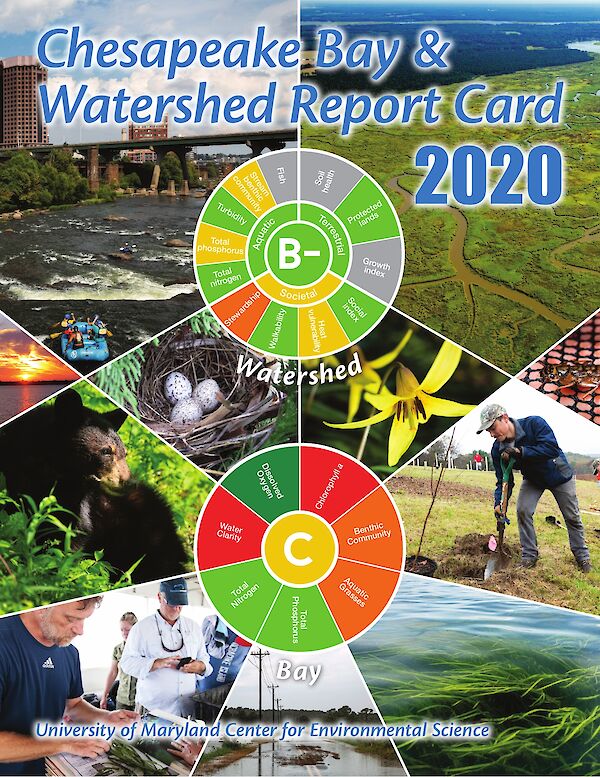
2020 Chesapeake Bay & Watershed Report Card
This report card provides a transparent, timely, and geographically detailed assessment of Chesapeake Bay. Since 2016, UMCES has engaged stakeholders throughout the watershed to transform the report card into an evaluation of the Chesapeake Watershed health. Watershed health includes traditional ecosystem indicators, but also social, economic, and cultural indicators. This is the second year the watershed has been scored, and four new indicators have been added. Additional indicators are being researched for use in the next report card.
Overall, the Chesapeake Watershed scored 64%, a B-. There were four aquatic indicators, one terretrial indicator, and four societal indicators.
Overall, Chesapeake Bay scored 45% in 2020, which improved slightly since 2019. Despite low scores in 2020, long-term trends are still showing improvement.
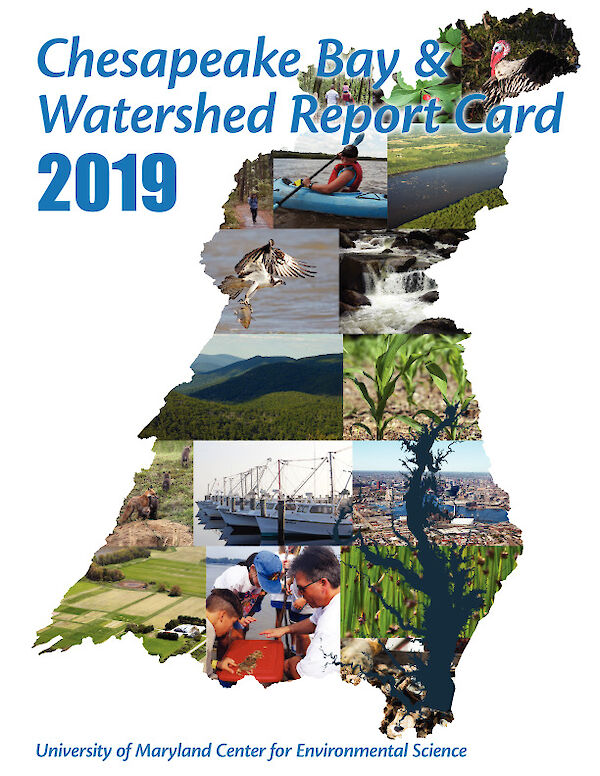
2019 Chesapeake Bay & Watershed Report Card
This report card provides a transparent, timely, and geographically detailed assessment of Chesapeake Bay. For the first time the report card includes an assessment of the Chesapeake Watershed as well. In 2019, the report card includes seven Bay health indicators and five Watershed health indicators. In 2019, the overall score for Chesapeake Bay is a 44%, a C-. This means the Bay is in moderate health. Despite the decrease in score from 2018, overall bay health is slightly improving over time. Long term trends of each reporting region health are also presented. For its first ever score, the Chesapeake Watershed scored 60%, a B-. This means the Watershed is in good health.
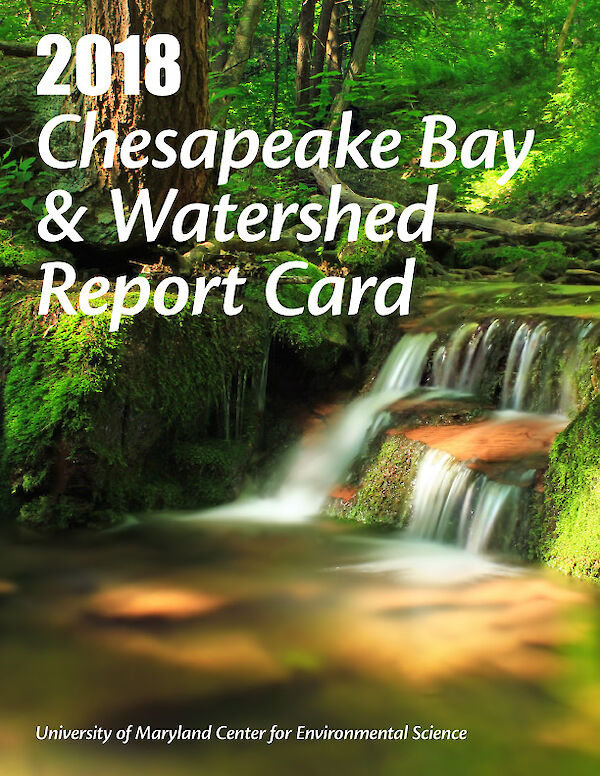
2018 Chesapeake Bay & Watershed Report Card
This report card provides a transparent, timely, and geographically detailed assessment of Chesapeake Bay. In 2018, the report card includes five water quality indicators and two biotic indicators. In 2018, the overall grade for Chesapeake Bay is a 46%, a C. This means the Bay is in moderate health. Despite the decrease in score from 2017, overall bay health is still significantly improving over time. Long term trends of each reporting region health and a fisheries index are also presented.
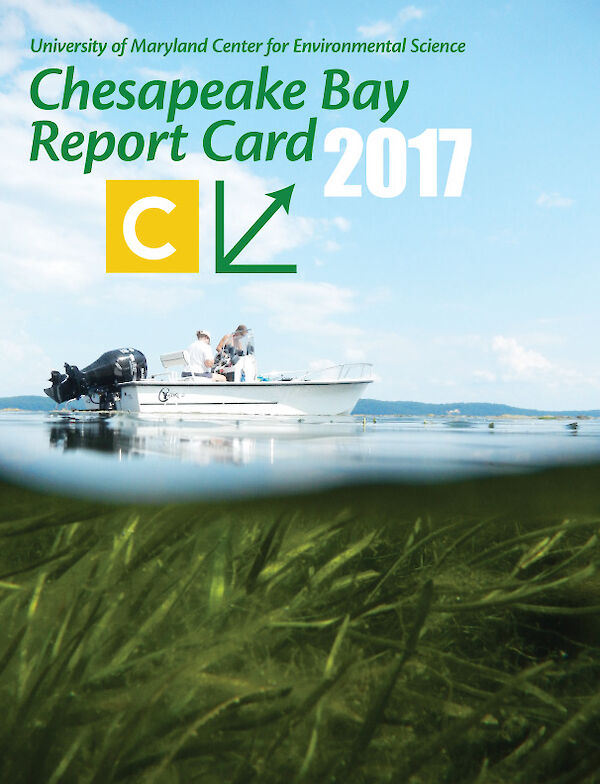
2017 Chesapeake Bay Report Card
The overall score for the Chesapeake Bay Health Index for 2017 was 54%, the same score as 2016. Bay-wide, dissolved oxygen continued to be the best scoring indicator with an 89% in 2017, an A. Aquatic grasses scored a C- (44%), improved from last year’s D+ (39%). Water clarity scored an F (17%), a decrease from last year’s D- (24%). Benthic community in the bay improved from a C (54%) to a B- (60%). Total nitrogen scored C+ (59%), an improvement from last year’s C+ (55%). Total phosphorus scored B+ (76%), declining from an A- (82%) in 2016. Chlorophyll a scored D+ (35%), the same as last year.

2016 Chesapeake Bay Report Card
This report card provides a transparent, timely, and geographically detailed assessment of Chesapeake Bay. In 2016, the report card includes five water quality indicators and two biotic indicators. In 2016, the overall grade for Chesapeake Bay is a 54%, a C. This means the Bay is in moderate health. Long term trends of each reporting region health and a fisheries index are also presented.
2015 Chesapeake Bay Report Card
This report card provides a transparent, timely, and geographically detailed assessment of Chesapeake Bay. In 2015, the report card includes five water quality indicators and two biotic indicators. In 2015, the overall grade for Chesapeake Bay is a 53%, a C. This means the Bay is in moderate health. Long term trends of each reporting region health and a fisheries index are also presented.
2014 Chesapeake Bay Report Card
This report card provides a transparent, timely, and geographically detailed assessment of Chesapeake Bay. In 2014, the report card includes five water quality indicators and two biotic indicators. In 2014, the overall grade for Chesapeake Bay is a 50%, a C. This means the Bay is in moderate health. A fisheries index and climate change resilience index as well as trajectories of reporting region health are also presented.
2013 Chesapeake Bay Report Card
This report card provides a transparent, timely, and geographically detailed assessment of Chesapeake Bay. In 2013, the report card includes five water quality indicators and two biotic indicators. In 2013, the overall grade for Chesapeake Bay is a 45%, a C. This means the Bay is in moderate health. Fisheries indicators as well as trajectories of reporting region health are also presented.
2012 Chesapeake Bay Report Card
This report card provides a transparent, timely, and geographically detailed assessment of Chesapeake Bay. In 2012, the methods for the report card have changed to include five water quality indicators and two biotic indicators. In 2012, the overall grade for ChesapeakeBay is a 47%, a C. This means the Bay is in moderate health. Fisheries indicators as well as trajectories of reporting region health are also presented.
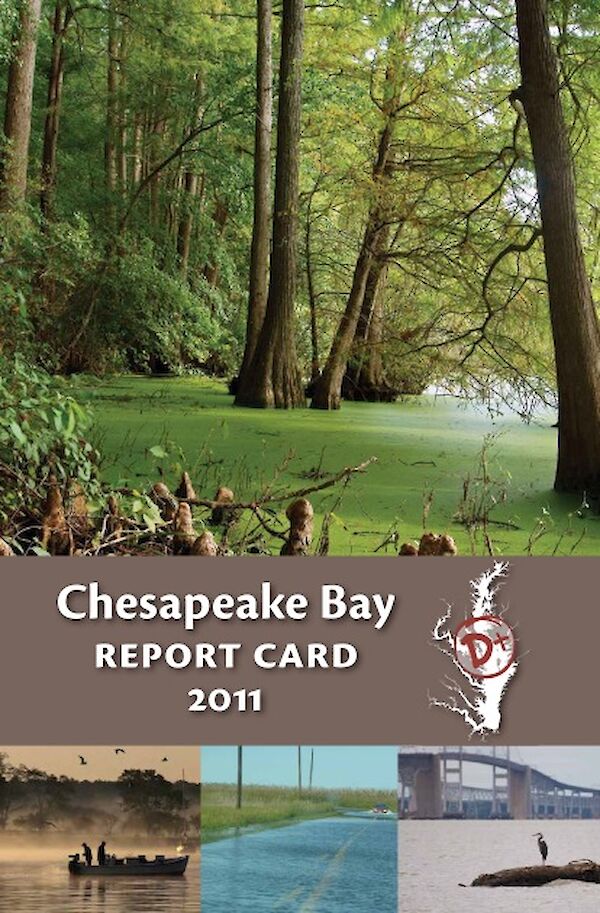
2011 Chesapeake Bay Report Card
This report card provides a transparent, timely, and geographically detailed assessment of Chesapeake Bay. The overall health of Chesapeake Bay, determined using water quality and biotic indicators, declined slightly in 2011. The overall grade of D+ was a decrease for the second year in a row, down from a C- in 2010. Only two reporting regions, the Patapsco and Back Rivers, and the Lower Western Shore (MD), had improved grades in 2011. The highest-ranked region for the second year in a row was the Upper Bay, with a grade of C.
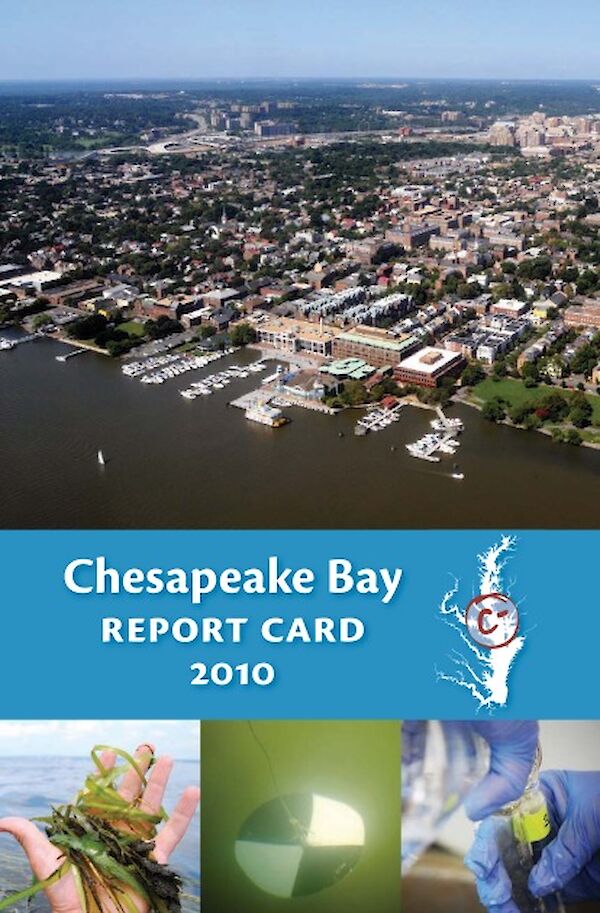
2010 Chesapeake Bay Report Card
This report card provides a transparent, timely, and geographically detailed assessment of 2010 Chesapeake Bay health. The overall health of Chesapeake Bay, assessed using water quality and biotic indicators, declined slightly in 2010. The overall grade decreased from a C in 2009 to C- in 2010. Only two reporting regions (James River and York River) had improved grades in 2010, three were unchanged, and nine declined. The highest-ranked region in previous years, the Upper Western Shore, decreased to fourth highest. The Upper Bay (C+) became the top-ranked region in 2010.
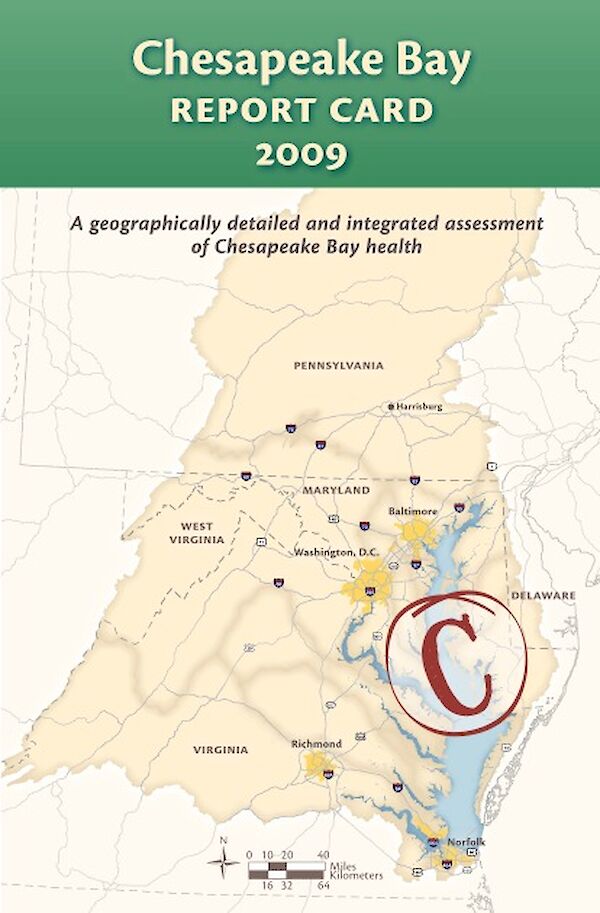
2009 Chesapeake Bay Report Card
This report card provides a transparent, timely, and geographically detailed assessment of 2009 Chesapeake Bay habitat health. The overall health of Chesapeake Bay, assessed using water quality and biotic indicators, was the best it has been since 2002. The overall grade improved from C- in 2008 to C in 2009. Eight reporting regions had improved grades in 2009, four were unchanged, and two had slightly worse grades. The highest ranked region, for the third year in a row, was the Upper WesternShore (B-), while the lowest ranked region this year was the Patapsco and Back Rivers (F).
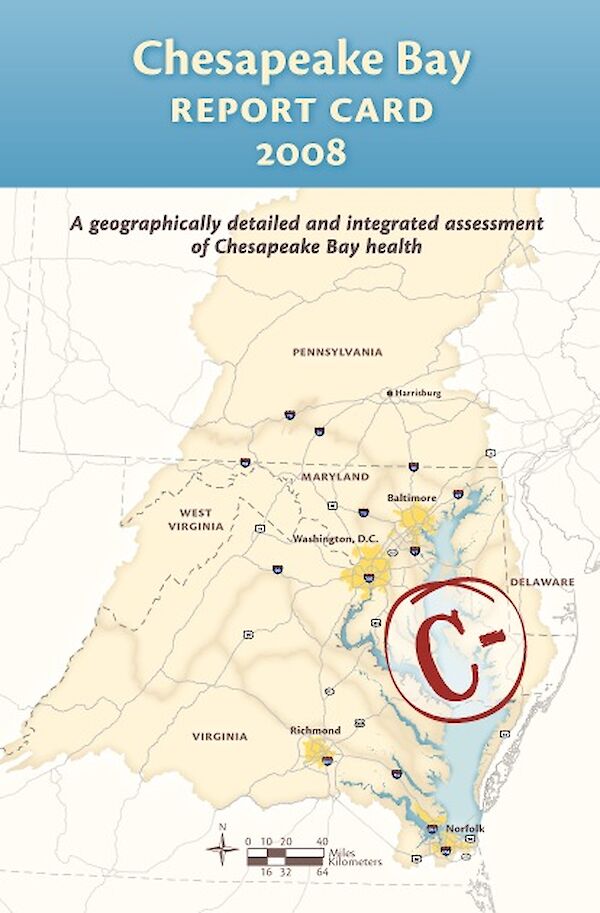
2008 Chesapeake Bay Report Card
This report card provides a transparent, timely, and geographically detailed annual assessment of 2008 Chesapeake Bay habitat health. This is the third year that the report card has been released. This report card rates 15 reporting regions of the Bay using six indicators that are combined into a single overarching index of habitat health. The overall health of Chesapeake Bay was poor in 2008, obtaining a grade of C-. Health of the 15 individual reporting regions varied, ranging from B- (moderate-good) to F (very poor).
2007 Chesapeake Bay Report Card
This report card provides a transparent, timely, and geographically detailed annual assessment of 2007 Chesapeake Bay habitat health. This is the second year that the report card has been released. This report card rates 15 reporting regions of the Bay using six indicators that are combined into a single overarching index of habitat health. Habitat health is defined as progress of the six indicators towards established scientifically derived ecological thresholds or goals. A low score therefore means that the region rarely meets the ecological threshold levels. A high score means that the region often meets the threshold levels.
2006 Chesapeake Bay Report Card
This report card provides a transparent, timely, and geographically detailed annual assessment of 2006 Chesapeake Bay habitat health. A report card will be released each year providing an assessment of the previous year’s habitat health. 2006 is the first year that the report card has been released. This report card rates 15 reporting regions of the Bay using six indicators that are combined into a single overarching index of habitat health. Habitat health is defined as progress of the six indicators towards established scientifically derived ecological thresholds or goals. A low score therefore means that the region rarely meets the ecological threshold levels. A high score means that the region often meets the threshold levels.