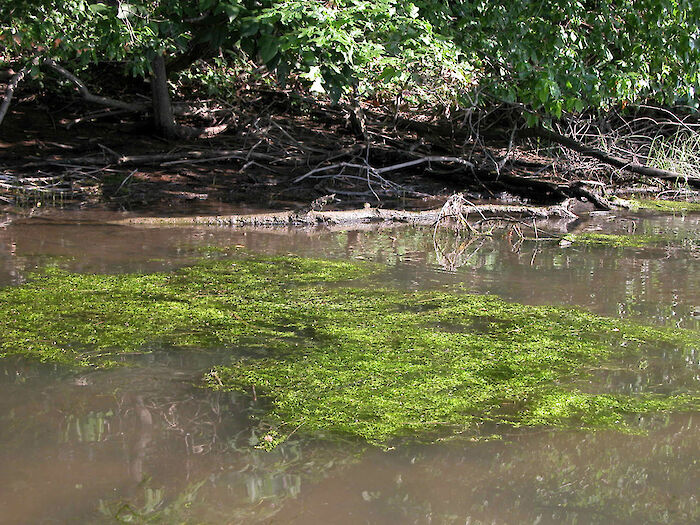
Nitrogen is important to all living things. Nutrients such as nitrogen occur naturally in both freshwater and saltwater. Plants and animals need nutrients to grow and survive. But when too much nitrogen enters the water it can fuel the growth of algae, creating dense blooms that block sunlight and reduce oxygen for fish and other organisms. Nitrogen runs off the land during rain events. Atmospheric nitrogen from industry settles on the water.
How is it measured?
Chesapeake Bay
Total nitrogen was measured at approximately 159 stations up to 8 times during the periods of interest (April to October). Total nitrogen is the amount of nitrate, nitrite, and ammonia that is dissolved in the water. The proportion of time that total nitrogen was above the threshold at each station was calculated.
2024 bay data provided by the Chesapeake Bay Program and accessed through the DataHub application: https://datahub.chesapeakebay.net/WaterQuality
Chesapeake Watershed
Total nitrogen was measured year round. Regions were only scored if they contained at least 120 observations and had good spatial coverage. Each sample was compared to the thresholds and the sample score was calculated. Sample scores were then averaged to the region level.
Data from 2012-2017 was used for the 2019 report card. Data from 2013-2018 was used for the 2020 report card. Data from 2014-2019 was used for the 2021 report card. Data from 2015-2020 was used for the 2022 report card. Data from 2016-2021 was used for the 2023/2024 report card. Data from 2017-2022 was used for the 2025 report card.
Threshold levels
Chesapeake Bay
Thresholds were determined by salinity regime.
| Salinity Regime | Reference Community Thresholds (mg L-1)* |
|---|---|
| Tidal Fresh | ≤0.9 |
| Oligohaline | ≤0.9 |
| Mesohaline | ≤0.6 |
| Polyhaline | ≤0.5 |
Chesapeake Watershed
Thresholds were determined by bioregion.*
| Score | Piedmont, Ridges, and Valleys Thresholds (mg L-1) | Coastal Plain thresholds (mg L-1) |
|---|---|---|
| 5 | <0.64 | <0.82 |
| 4 | ≥0.64 - <1.65 | ≥0.82 - <1.52 |
| 3 | ≥1.65 - <2.15 | ≥1.52 - <2.22 |
| 2 | ≥2.15 - <2.65 | ≥2.22 - <2.66 |
| 1 | ≥2.65 - <3.66 | ≥2.66 - <3.61 |
| 0 | ≥3.66 | ≥3.61 |