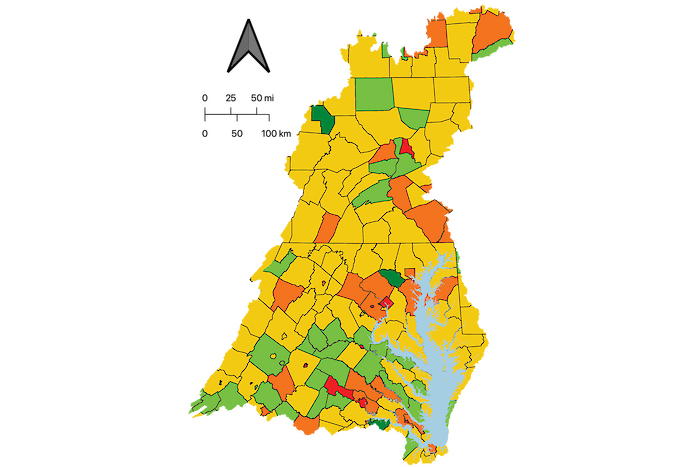
This indicator, the percentage of jobs gained or lost (net) per capita over the previous year, suggests whether the economy as a whole is growing. Strong job growth can reflect local economic vitality, a healthy business environment, and good entrepreneurship. It also reflects that national macroeconomy and the global economy, but the differences among neighboring counties highlight local performance (source: U.S. Census).
How is it measured?
The U.S. Census Business Dynamics Statistics program has employment data at the county level. The percent change in the number of people employed is calculated for the most recent year available, which was 2022 for the 2025 report card. The 197 counties that intersect the Chesapeake Bay watershed boundary were scored, aggregated into regions, and then weighted by population. Data are from the U.S. Census Bureau (https://data.census.gov/).
Threshold levels
Scoring is based on the percent change in employment, so that a 5% decrease equates to a score of 0 and a 5% increase equates to a score of 100. Scores were capped between 0 and 100.
