If you are looking for more technical information about the health of the Maryland Coastal Bays, you might like to read some of the related publications on IAN Press.
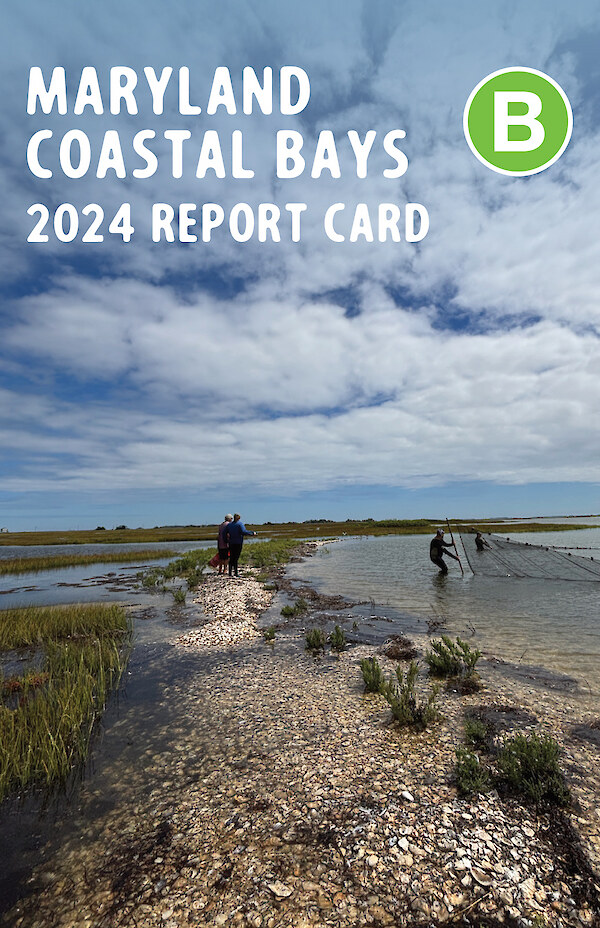
2024 Maryland Coastal Bays Report Card
Coastal Bays health is defined as the progress of four water quality indicators (nitrogen, phosphorus, chlorophyll a, and dissolved oxygen) and two biotic indicators (seagrass and hard clams) toward scientifically derived ecological thresholds or goals. The Coastal Bays had an overall score of B for 2024, an improvement from last year and the highest score the Coastal Bays have ever achieved.
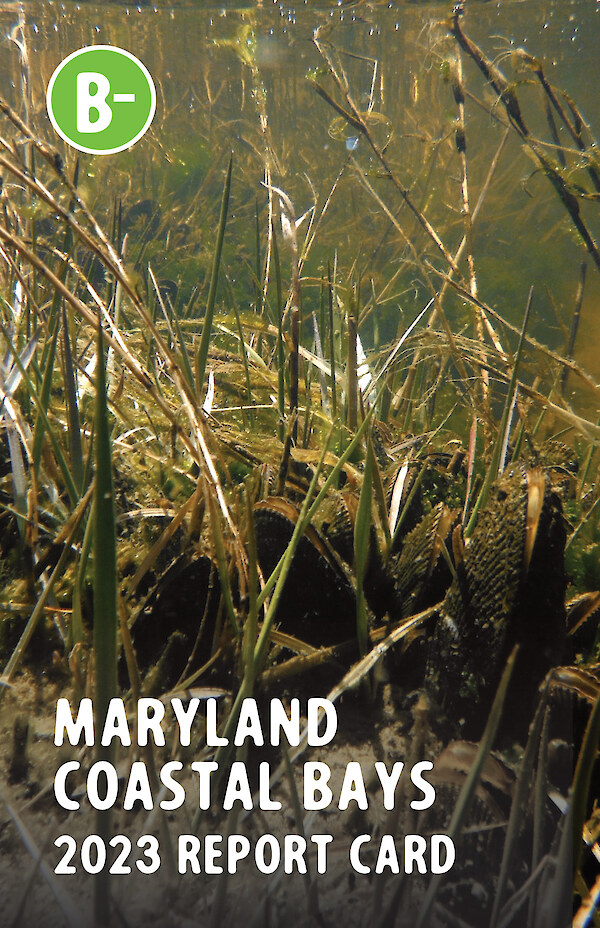
2023 Maryland Coastal Bays Report Card
Coastal Bays health is defined as the progress of four water quality indicators (nitrogen, phosphorus, chlorophyll a, and dissolved oxygen) and two biotic indicators (seagrass and hard clams) toward scientifically derived ecological thresholds or goals. The Coastal Bays had an overall score of B- for 2023 and improved from the previous year.
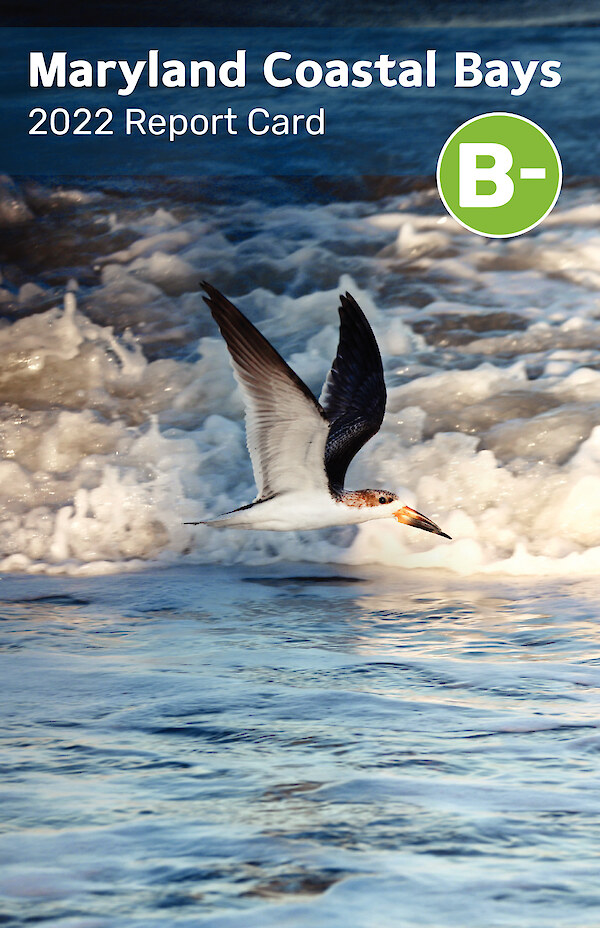
2022 Maryland Coastal Bays Report Card
Coastal Bays health is defined as the progress of four water quality indicators (nitrogen, phosphorus, chlorophyll a, and dissolved oxygen) and two biotic indicators (seagrass and hard clams) toward scientifically derived ecological thresholds or goals. The Coastal Bays had an overall score of B- for 2022, an incremental improvement over last year.
2022 State of the Bays Report
The State of the Bays Report is a product of the partnership between Maryland Coastal Bays Program, Maryland Department of Natural Resources, National Park Service, and the University of Maryland Center for Environmental Science. This comprehensive report summarizes challenges, achievements, and changes in the Coastal Bays over the last several years, and actions needed to ensure its resilience in the future.
2021 Maryland Coastal Bays Report Card
Coastal Bays health is defined as the progress of four water quality indicators (nitrogen, phosphorus, chlorophyll a, dissolved oxygen) and two biotic indicators (seagrass, hard clam) toward scientifically derived ecological thresholds or goals. The Coastal Bays had an overall score of C+, a slight improvement from the previous year. Improved total phosphorus scores contributed to the slightly higher overall health of the bays. Seagrass scores ranged from poor or very poor throughout the entire Coastal Bays. This assessment represents the status of water quality and seagrasses in 2021 and hard clams in 2019.
2019-2020 Maryland Coastal Bays Report Card
The aim of this report card is to provide a transparent, timely, and geographically detailed assessment of 2019-2020 Coastal Bays health. Coastal Bays health is defined as the progress of four water quality indicators (total nitrogen, total phosphorus, chlorophyll a, dissolved oxygen) and two biotic indicators (seagrass, hard clams) toward scientifically derived ecological thresholds or goals. The six indicators are combined into one overarching Coastal Bays Health Index, which is presented as the report card score. The overall score for the Coastal Bays was a C+ for the 2019-2020 reporting cycle. This was a decrease from the last full year of data in 2017.
2018 Maryland Coastal Bays Report Card
The aim of this report card is to provide a transparent, timely, and geographically detailed assessment of 2018 Coastal Bays health. Coastal Bays health is defined as the progress of four water quality indicators (total nitrogen, total phosphorus, chlorophyll a, dissolved oxygen) and two biotic indicators (seagrass, hard clams) toward scientifically derived ecological thresholds or goals. The six indicators are combined into one overarching Coastal Bays Health Index, which is presented as the report card score. The Coastal Bays get "incompletes" for both seagrass and hard clams this year due to issues in collecting the data in 2018.
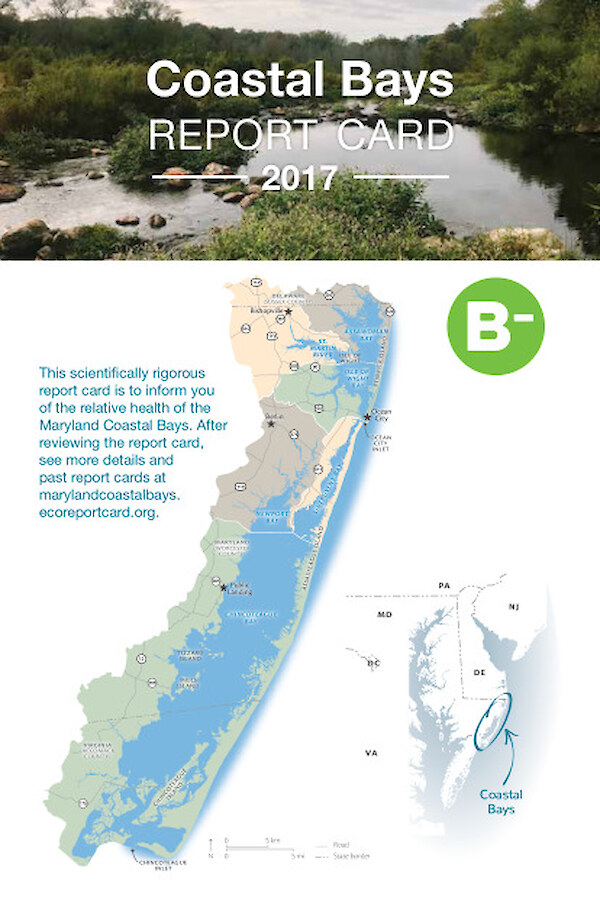
2017 Maryland Coastal Bays Report Card
The aim of this report card is to provide a transparent, timely, and geographically detailed assessment of 2017 Coastal Bays health. Coastal Bays health is defined as the progress of four water quality indicators (total nitrogen, total phosphorus, chlorophyll a, dissolved oxygen) and two biotic indicators (seagrass, hard clams) toward scientifically derived ecological thresholds or goals. The six indicators are combined into one overarching Coastal Bays Health Index, which is presented as the report card score. The overall score for the Coastal Bays was a B- in 2017, a small improvement over the score from last year.
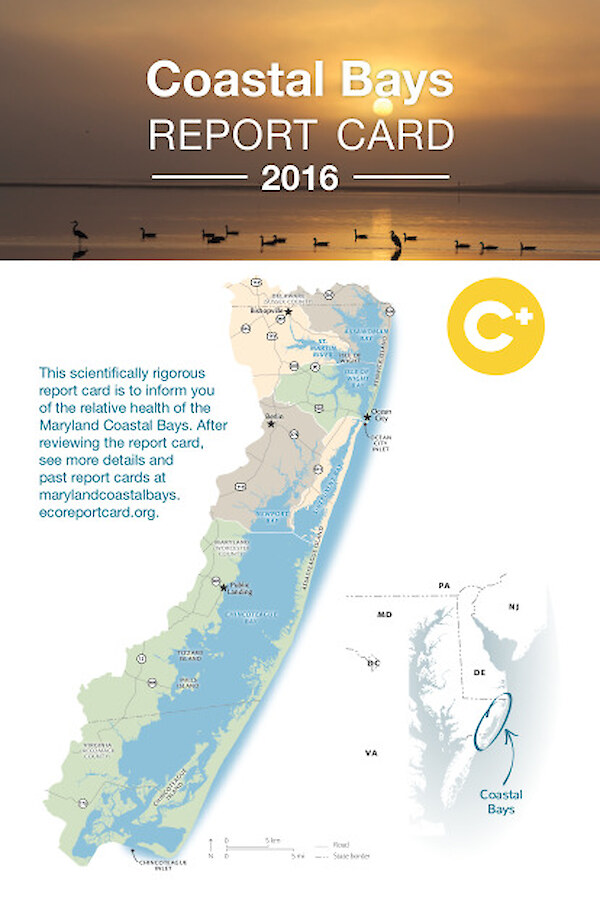
2016 Maryland Coastal Bays Report Card
The aim of this report card is to provide a transparent, timely, and geographically detailed assessment of 2016 Coastal Bays health. Coastal Bays health is defined as the progress of four water quality indicators (total nitrogen, total phosphorus, chlorophyll a, dissolved oxygen) and two biotic indicators (seagrass, hard clams) toward scientifically derived ecological thresholds or goals. The six indicators are combined into one overarching Coastal Bays Health Index, which is presented as the report card score. The overall score for the Coastal Bays was a C+ in 2016, a very similar score to the previous year.
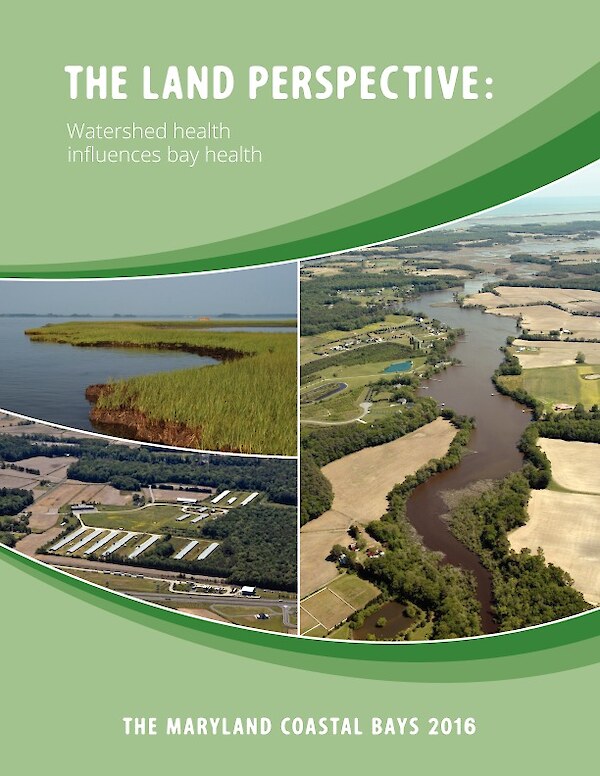
Maryland Coastal Bays 2016: Land and bay perspectives
This booklet provides an overview of the current science and management issues in the Maryland Coastal Bays and their watersheds in 2016. Previous assessments include the 2004 State of the Maryland Coastal Bays and the 2009 book, Shifting Sands: Environmental and cultural change in Maryland’s Coastal Bays.
Recognizing the importance of both a bay perspective and a land perspective, this booklet provides current data and insights into a) how bay health is influenced by ocean and land and b) how watershed health influences bay health. It includes two ‘booklets’ in one publication—one intended for those interested in the bay perspective, and the other for those interested in the land perspective. The two documents culminate in a summary centerfold which focuses on both watershed and bay issues.
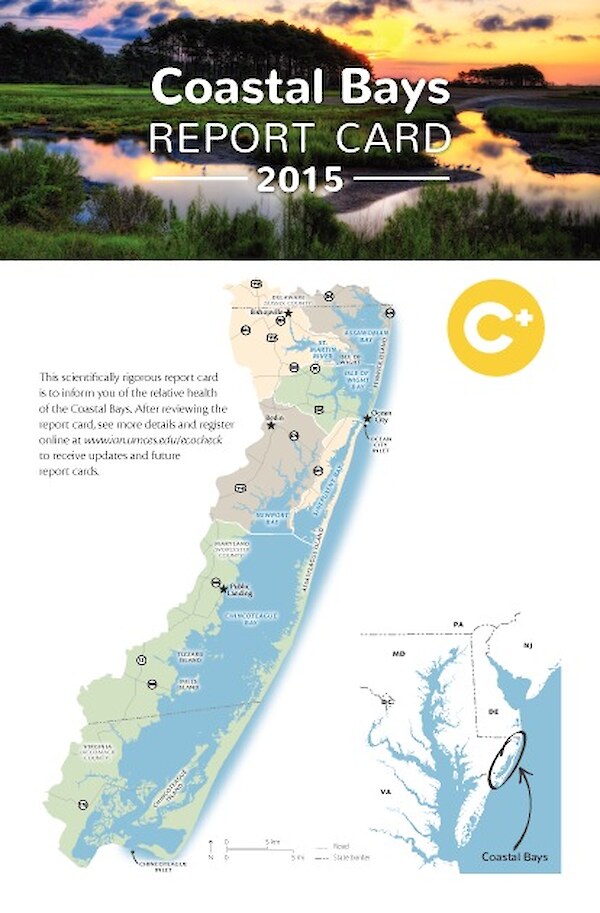
2015 Maryland Coastal Bays Report Card
The aim of this report card is to provide a transparent, timely, and geographically detailed assessment of 2015 Coastal Bays health. Coastal Bays health is defined as the progress of four water quality indicators (total nitrogen, total phosphorus, chlorophyll a, dissolved oxygen) and two biotic indicators (seagrass, hard clams) toward scientifically derived ecological thresholds or goals. The six indicators are combined into one overarching CoastalBays Health Index, which is presented as the report card score. The overall score for the Coastal Bays was a C+ in 2015, a very similar score to the previous year.
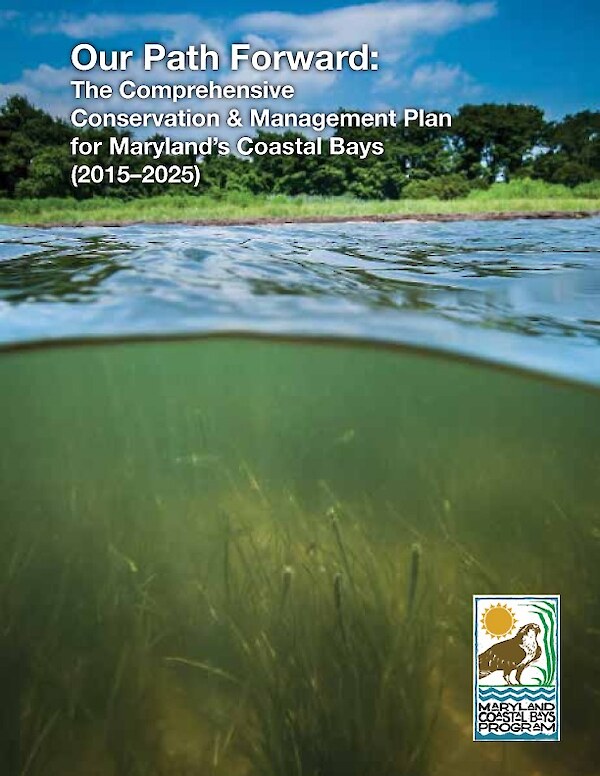
2015 Comprehensive Conservation & Management Plan
Our Path Forward represents a revision to the 1999 Comprehensive Conservation & Management Plan for the Coastal Bays of Maryland. The work is the culmination of three years (2012–2014) of technical investigation and community involvement to protect the future of the Coastal Bays.

2014 Maryland Coastal Bays Report Card
The aim of this report card is to provide a transparent, timely, and geographically detailed assessment of 2014 Coastal Bays health. Coastal Bays health is defined as the progress of four water quality indicators (total nitrogen, total phosphorus, chlorophyll a, dissolved oxygen) and two biotic indicators (seagrass, hard clams) toward scientifically derived ecological thresholds or goals. The six indicators are combined into one overarching CoastalBays Health Index, which is presented as the report card score. The overall score for the Coastal Bays was a C+ in 2014, a very similar score to the previous year.
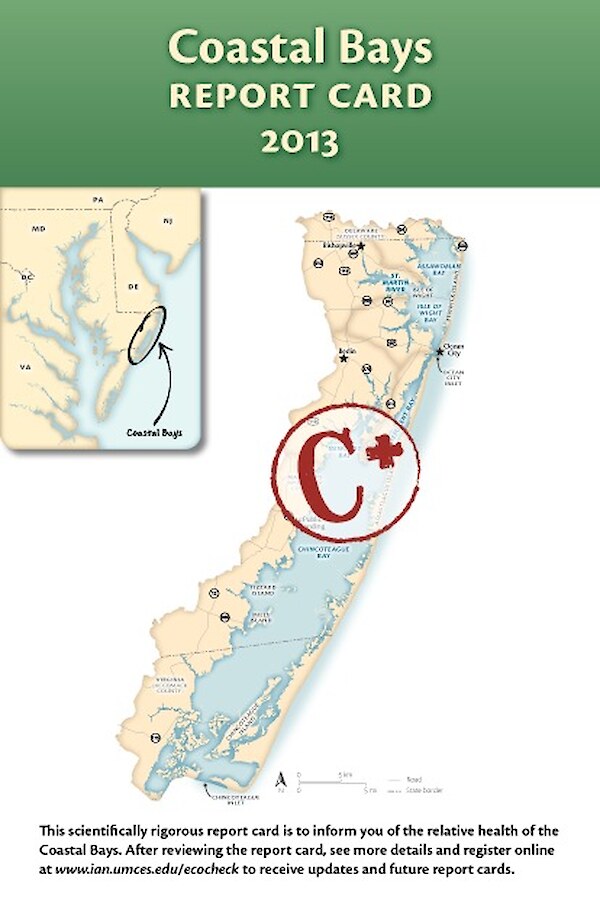
2013 Maryland Coastal Bays Report Card
The aim of this report card is to provide a transparent, timely, and geographically detailed assessment of 2013 Coastal Bays health. Coastal Bays health is defined as the progress of four water quality indicators (total nitrogen, total phosphorus, chlorophyll a, dissolved oxygen) and two biotic indicators (seagrass, hard clams) toward scientifically derived ecological thresholds or goals. The six indicators are combined into one overarching CoastalBays Health Index, which is presented as the report card score. The overall score for theCoastal Bays was a C+ in 2013, with a slight improvement since 2012.
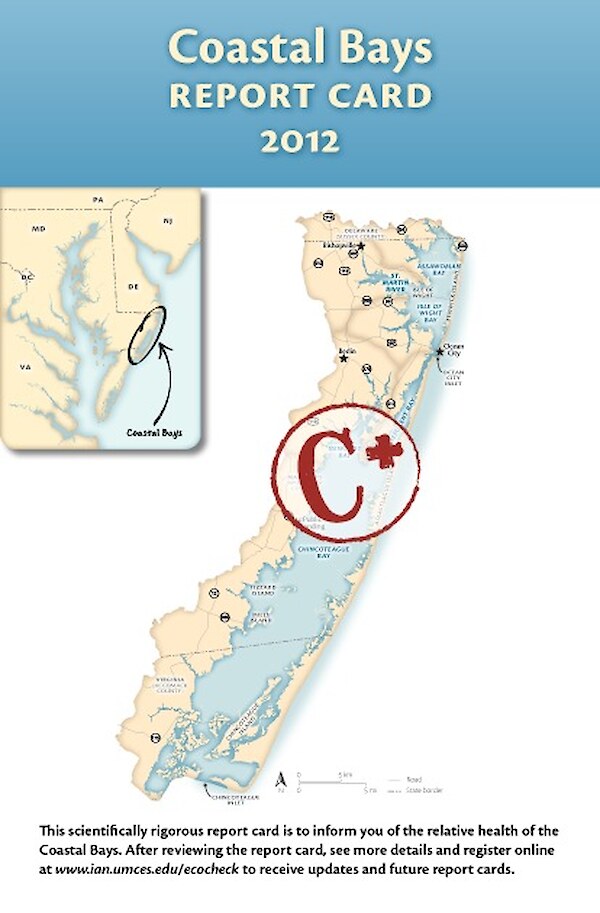
2012 Maryland Coastal Bays Report Card
The aim of this report card is to provide a transparent, timely, and geographically detailed assessment of 2012 Coastal Bays health. Coastal Bays health is defined as the progress of four water quality indicators (total nitrogen, total phosphorus, chlorophyll a, dissolved oxygen) and two biotic indicators (seagrass, hard clams) toward scientifically derived ecological thresholds or goals. The six indicators are combined into one overarching Coastal Bays Health Index, which is presented as the report card score. The overall score for the Coastal Bays was a C+ in 2012, with a slight improvement since 2011.
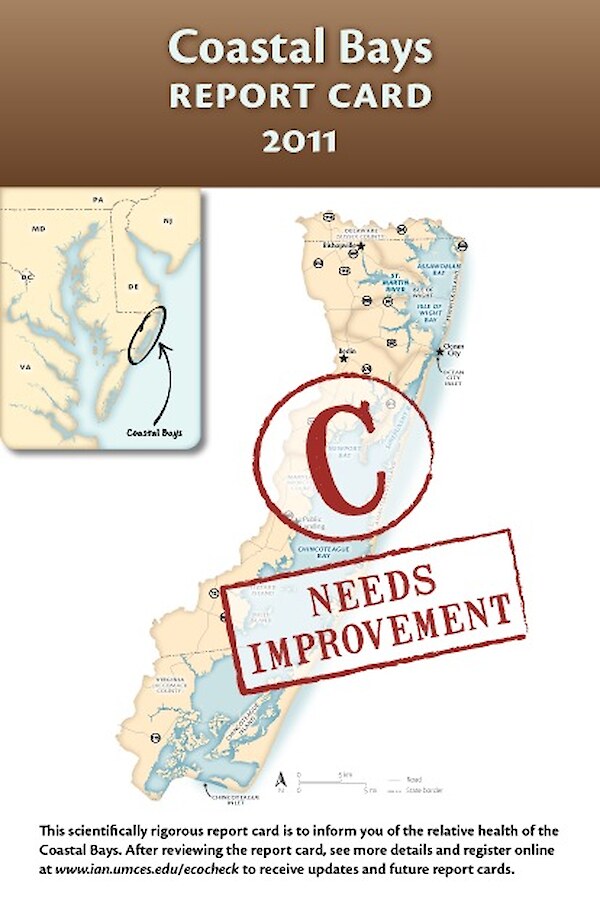
2011 Maryland Coastal Bays Report Card
The aim of this report card is to provide a transparent, timely, and geographically detailed assessment of 2011 Coastal Bays health. Coastal Bays health is defined as the progress of four water quality indicators (total nitrogen, total phoshorus, Chlorophyll a, dissolved oxygen) and two biotic indicators (seagrass, hard clams) toward scientifically derived ecological thresholds or goals. The six indicators are combined into one overarching Coastal Bays Health Index, which is presented as the report card score. The overall score for the Coastal Bays was a C in 2011, with little change since 2010.
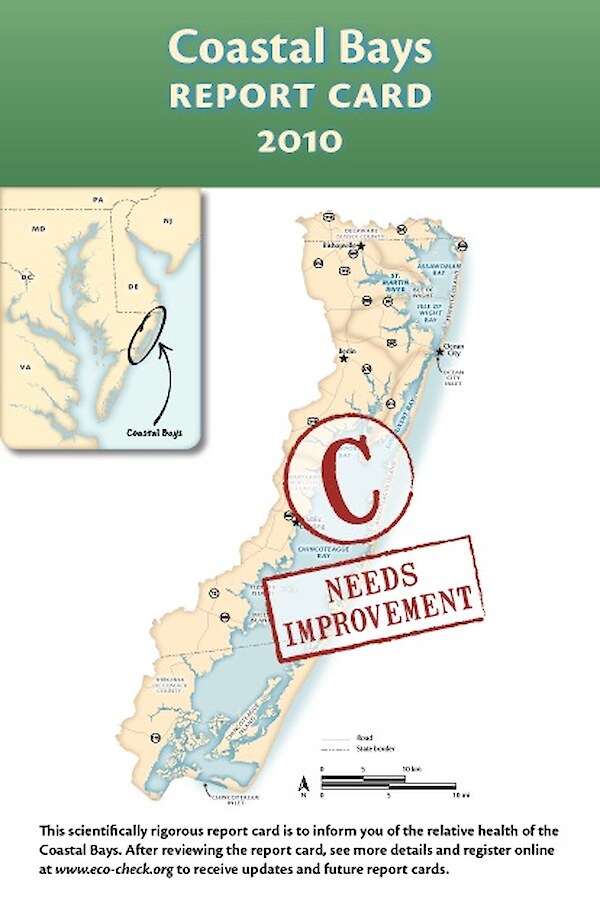
2010 Maryland Coastal Bays Report Card
The aim of this report card is to provide a transparent, timely, and geographically detailed assessment of 2010 Coastal Bays health. Coastal Bays health is defined as the progress of four water quality indicators (TN, TP, Chl a, DO) and two biotic indicators (seagrass, hard clams) toward scientifically derived ecological thresholds or goals. The six indicators are combined into one overarching Coastal Bays Health Index, which is presented as the report card score. Detailed methods are available at www.eco-check.org/reportcard/mcb/2010/. The overall score for the Coastal Bays was a C in 2010. All regions declined in overall health when compared to 2009.
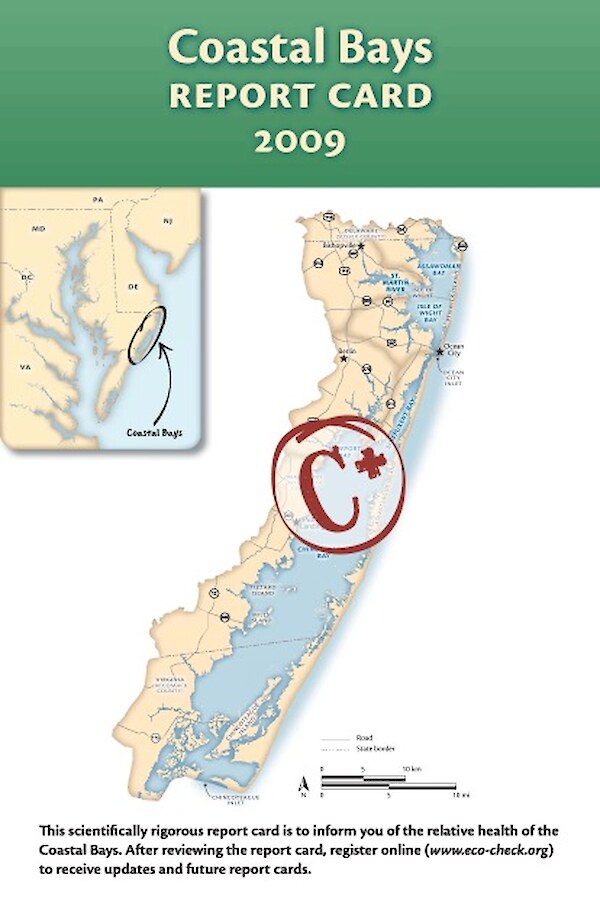
2009 Maryland Coastal Bays Report Card
The aim of this report card is to provide a transparent, timely, and geographically detailed assessment of 2009 Coastal Bays health. Coastal Bays health is defined as the progressof four water quality indicators (TN, TP, Chl a, DO) and two biotic indicators (seagrass, hard clams) toward scientifically derived ecological thresholds or goals. The six indicators are combined into one overarching Coastal Bays Health Index, which is presented as the report card score. The overall score for the Coastal Bays was a C+ in 2009. While the northern bays and western tributaries continue to struggle, there are signs of improvement in some areas. However, the southern bays—historically the more pristine of the Coastal Bays—are showing signs of degradation.
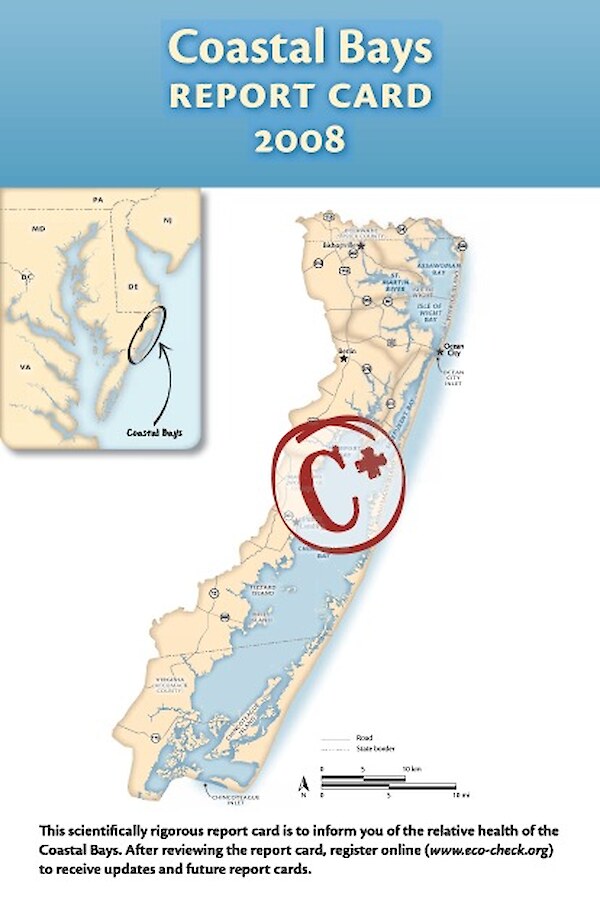
2008 Maryland Coastal Bays Report Card
This report card provides a transparent, timely, and geographically detailed assessment of 2008 Coastal Bays’ health. Prepared annually, the report card rates six reporting regions of theCoastal Bays, using six indicators combined into a single overarching index of health. Health is defined as progress towards established scientifically derived ecological thresholds or goals. The overall health of Coastal Bays was moderate in 2008, obtaining a grade of C+.
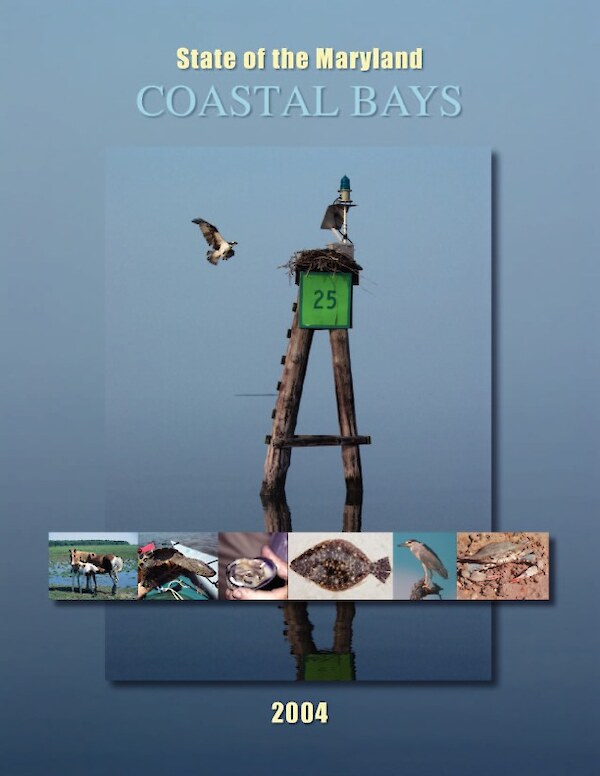
2004 State of the Bays report
This report summarizes monitoring data collected over the past several years for water quality, aquatic living resources, and habitat categories. It utilizes conceptual diagrams for each reporting region to highlight the key ecosystem processes, biota and estuarine health problems.