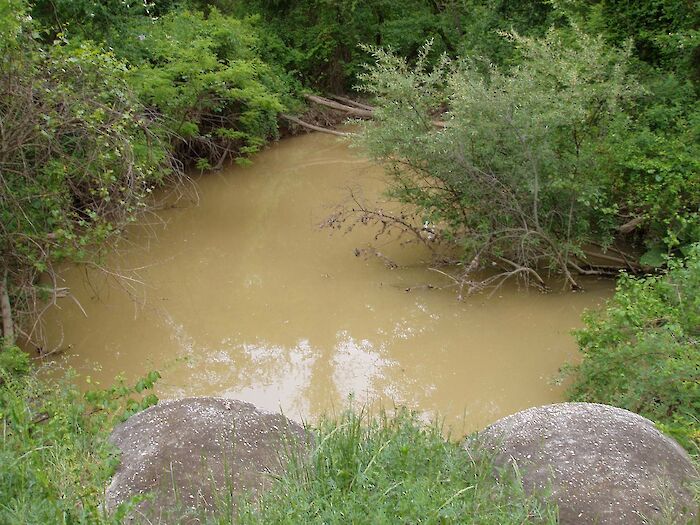
Turbidity is a measure of water clarity that expresses how much light passes through the water column. It is dependent upon the amount of suspended particles (e.g., sediment, algae, bacteria) and colored organic matter present. Clear water is critical for the growth and survival of fish, crabs, and other aquatic organisms.
How is it measured?
Turbidity was measured year round, and is defined as the amount of particles in the water measured as NTUs. Regions were only scored if they contained at least 120 observations and had good spatial coverage. Each sample was compared to the thresholds and the sample score was calculated. Sample scores were then averaged to the region level.
Data from 2012-2017 was used for the 2019 report card. Data from 2013-2018 was used for the 2020 report card. Data from 2014-2019 was used for the 2021 report card. Data from 2015-2020 were insufficient for scoring regions in the 2022 report card. Data from 2016-2021 were insufficient for scoring regions in the 2023/2024 report card. Data from 2017-2022 was used for the 2025 report card.
Threshold levels
Multiple thresholds for turbidity were determined by using government standard values; 3.0 nephelometric turbidity units (NTUs) is a value EPA recommends as a pass/fail level, and 10.0 NTUs was a level determined by MD DNR (US EPA 2000; Kilian et al. 2006). By anchoring 3.0 as the 4 value and 10.0 as the 1 value, equal intervals were used to determine the remaining threshold levels.*
| Score | Turbidity Thresholds (NTUs) |
|---|---|
| 5 | <3 |
| 4 | ≥3 - <4.75 |
| 3 | ≥4.75 - <6.5 |
| 2 | ≥6.5 - <8.25 |
| 1 | ≥8.25 - <10 |
| 0 | ≥10 |
