This indicator responds to growing attention, nationally and globally, to income inequality. High levels of inequality are correlated with, among other things, life expectancy, infant mortality, crime, and social instability (source: U.S. Census).
How is it measured?
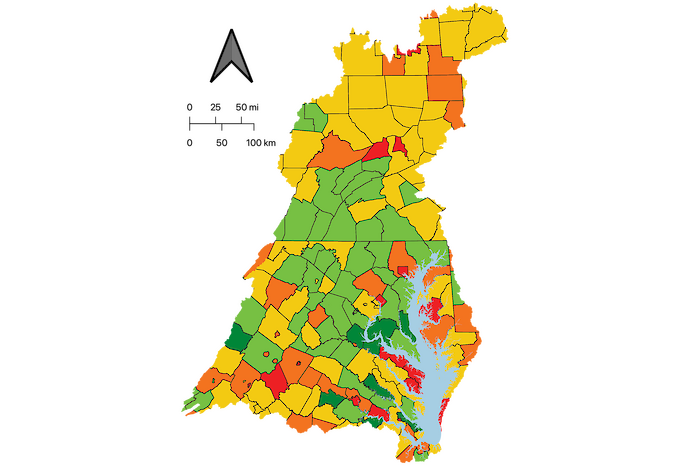
A standard measure of income inequality is the Gini Coefficient. A completely evenly distributed income, with say 50% of the population having 50% of the income, has a Gini Coefficient of 0. The higher the Gini Coefficient (with a ceiling of 1), the higher the level of inequality. The U.S. Census five-year American Community Survey contains GINI Coefficient data at the county level. The data of the 197 counties that intersect the Chesapeake Bay watershed boundary are scored based on their Gini Coefficient, aggregated into regions, and then weighted by population. Data are from the U.S. Census Bureau (https://data.census.gov/).
Threshold levels
County-level Gini coefficient scores were converted to a 0–100 scale so that a Gini coefficient of < 0.2 was scored as 100%, 0.2–0.3 was scored between 99%–80%, 0.3–0.4 was scored between 79%–40%, and >0.4 was scored between 39%–0%. County-level scores were population-weighted and summed to calculate the region score. Region scores were weighted by their population size to calculate an overall score for the Chesapeake Bay Watershed.
| Gini Coefficient Threshold | Report Card Score | Equation |
|---|---|---|
| <0.2 | 100 | |
| 0.2–0.3 | 99–80 | y = -200x + 140 |
| >0.3–0.4 | 79–40 | y = -400x + 200 |
| >0.4 | 39–0 | y = -400x + 200 |