This indicator captures the percentage of households that can find affordable housing. The Department of Housing and Urban Development (HUD) defines housing as affordable if payments are under 30 percent of income. In the 1960s the poverty line was defined by the cost of a minimum diet times three but in the six decades since, the rising cost of housing has required more attention to this variable as a measure of economic well-being (source: U.S. Census).
How is it measured?
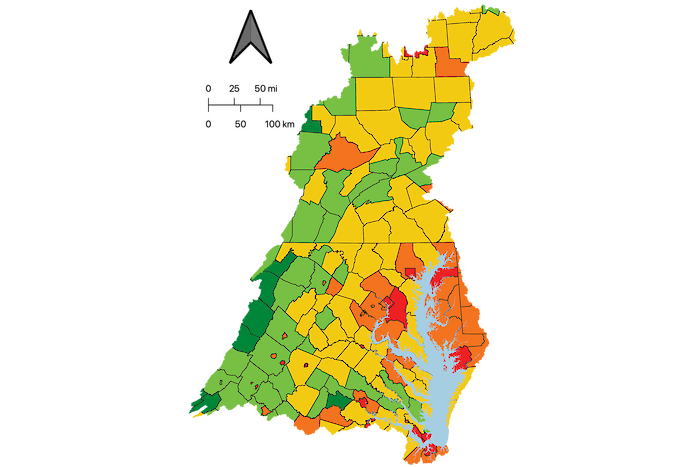
The U.S. Census five-year American Community Survey contains affordable housing data at the county level. The indicator reflects the combined number of Owner-occupied housing units and Renter-occupied housing units in which housing costs exceed 30% of the household income. The data of the 197 counties that intersect the Chesapeake Bay watershed boundary are aggregated into regions, converted to a report card score (which is reversed), and then weighted by population. Data are from the U.S. Census Bureau (https://data.census.gov/).
Threshold levels
Scoring is based on the percent of households that spend 30% or more of their income on housing. If 50% or more of households spend ≥ 30% of their income on housing, it scores a zero. If 100% are spending less than 30%, it would score a 100. For the 50% to 100% range of households spending less than 30% of their income on housing, the score scales from 0-100.